Realizing cloud value for a render platform at Wayfair — Part 2
Jack Brooks
Wayfair; 3DTools Group
Yusuf Nazami
Senior Staff Engineer at Wayfair
In our previous post, we discussed various cost optimization strategies that we here at Wayfair identified to use on a render platform that we had recently moved to Google Cloud using a lift-and-shift migration strategy. In this post, we’ll shift our focus to how we applied those strategies to plan and execute the initiatives, and share what we learned.
Plan and execute
Once we identified the key cost and usage levers, our workgroup partnered with engineers, analytics, and Google Cloud to come up with a plan and execution framework. We set up high-level objectives and key results with a baseline and target to align the team and get stakeholders’ buy-in.
Objective: Render each asset most efficiently without compromising on quality
KR1: Reduce Render Core Cost Per Hour by 30%
KR2: Reduce Avg Render Time Per Image Request by 35%
Initiatives and prioritization
We identified our key initiatives and pushed teams to come up with efforts and ROI calculations for each of them, and placed them on a quadrant of savings and efforts. Using this quadrant we identified low-effort initiatives that will yield mid-to-high savings. We also identified other high-cost high savings initiatives, and saved them for later. You can find other examples of balancing effort with spend in the following diagram.
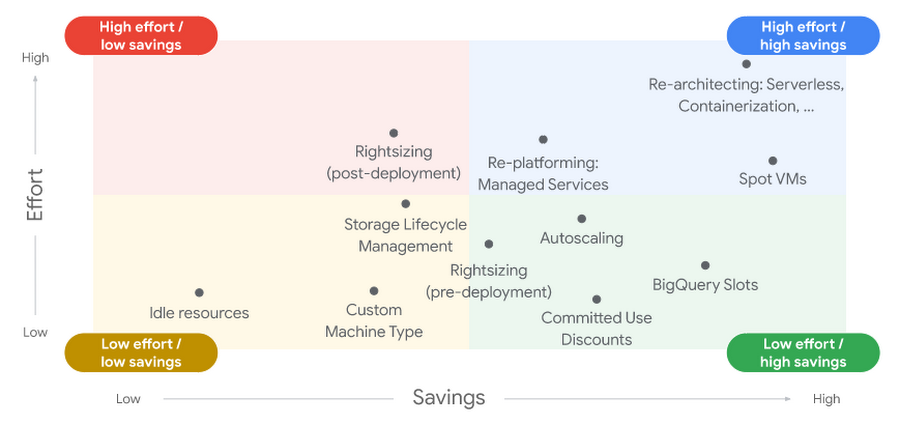
Using the framework above we executed the following initiatives in the order outlined:
Jun 2022
Implement cost dashboards: We created a deep-dive Render cost dashboard using Cloudability to track every aspect of the spend on the Render Farm by providing daily, weekly and monthly trends on each bucket of cost on the Google Cloud project for Rendering, providing engineers and leaders a clear view of spend on Google Cloud.
Schedule shutdowns: One of the first things we did was shut down a high percentage of farm capacity on the weekend; this was a no-brainer after looking at the render-hour usage data on weekends.
Optimize render settings: We adjusted Global Illumination, Max Subdivision, and Radiance for scenes used in modeling to reduce the number of hours needed to produce images with similar quality.
Rightsize Automated farm: We also cut the Automated farm size by 30% to improve the overall farm utilization based on the usage models.
Jul 2022
Deploy multiple MIGs with Instance Types: For our on-prem render nodes, we initially optimized them for the top 10th percentile workload with the Google C2D-Standard-30 instance type. Based on recommendations from Google we benchmarked the new TAU instances and found their T2D-Standard-16 performs better for 90% of our use cases with a savings of more than 50%.
Reduce images per round: We noticed that some images rendered on the farm did not add any value, and in certain cases were never utilized at all. We removed certain class-specific images from rendered requests to reduce the wasted renders per round of work, and hence reduce workload requirements further.
Implement self-service render usage dashboard: We worked closely with our partners in Data Engineering to create real-time visibility into render-hours usage along with the ability to slice data around various dimensions to allow them to identify any waste as early as possible and address it the same.
Aug 2022
Autoscaling: In close partnership with Google Cloud and the analytics team, we created a custom scaling algorithm that looks into current farm usage, submission volume and patterns to control the deployed nodes on the farm at regular intervals; this helped us achieve a target utilization of 90%+ on the render farm.
In a period of 5 months from May 2022 to Sep 2022, our monthly costs went down by approximately 85%. We achieved all this without any impact on core business objectives around imagery quality or speed of delivery. And we’re not done yet: we’re planning to drive further savings of ~25%+ by eliminating license costs over the next few months. In addition, we will be exploring Spot instances and optimizing Artist pools further to drive further savings on the cloud.
Gaining knowledge through experience
Throughout the cost optimization process, we learned a lot. Here are some highlights.
Work collaboratively
The speed and level of optimization we saw were possible due to a very tight collaboration between engineering, business, infrastructure, and Google teams. The business played an instrumental role in identifying opportunities to optimize and rightsizing the quality and throughput of the pipeline. Google Cloud team jumped in multiple times during design phases to point us in the right direction when selecting machine types or building algorithms to auto-scale within constraints, helping us save more. They even helped for cost modeling. The Google teams were tremendously insightful.
Plan and execute
Going in, we set clear rules for ourselves: Design and pressure-test initiatives. . Whiteboard before keyboard to validate each initiative. And prioritize initiatives ruthlessly during deep dives. There are so many ways to achieve the end goal, but sequencing them using Google’s FinOps and Cost optimization framework helped us plug the leaks immediately with low-effort, high-savings initiatives. Once we identified the initiatives, we delivered them in small increments every couple of weeks, driving immediate impact on our spend.
Measure and iterate
Finally, we created realistic objectives and measurable key results for the team and provided complete transparency to every member of the team through weekly metric reporting. To drive accountability and ownership on an ongoing basis, we created reports and dashboards along with proactive monitors to provide teams with deep-dive data on render-farm usage, and daily costs. Best of all, we’re just getting started: Thanks to the visibility provided by these data points, we continue to identify opportunities to fine-tune both cost per hour and render hour usage. To learn more about how to identify and implement cost savings in your environment, we highly recommend Google Cloud’s whitepaper, Understand the principles of cloud cost optimization.
Googler Hasan Khan, Lead Principal Architect, Retail Global, contributed to this post.