How rapid integrated clinical data helps prioritize care for a vulnerable population
Valmeek Kudesia
MD, CCA Vice President of Clinical Informatics & Advanced Analytics
Editor’s note: When the COVID-19 pandemic arrived in the U.S. earlier this year, healthcare organizations had to quickly change or speed up their plans to serve patients. Commonwealth Care Alliance (CCA) used data analytics from Google Cloud to connect clinicians and care managers with high-risk members. Valmeek Kudesia, vice president of clinical informatics and advanced analytics at CCA, shares their story.
CCA is a community-based healthcare organization nationally recognized as a leader in providing and coordinating care for high-cost, high-need individuals who are dually eligible for Medicaid and Medicare. CCA integrates the roles of healthcare payor, care management organization, and direct care provider to serve these individuals (known as “members”). Our members live with medical, behavioral health, and social challenges. Many have complicated lives and almost all are vulnerable or marginalized. When news of COVID-19 arrived here in the U.S. last winter, we knew our members would need enhanced levels of care and attention. We needed to deliver on our mission of serving our members while accounting for many new and rapidly changing factors.
Our dedicated staff and clinicians needed reliable data that was available quickly and integrated across many domains and sources. We had already put in place an advanced analytics platform with Google Cloud’s BigQuery and Looker. Six months later, we’ve established trust in our data and provide our clinicians with a more holistic view of members’ needs—extending our ability to provide compassion and care to our members, i.e., human-centered use of data and analytics. We will continue to lean upon our data to best serve our members during the upcoming combination of COVID-19 and influenza.

The data required to make decisions faster
The platform we’d chosen was built for a situation where many users must move fast and in different directions and quickly change what data or information they need. This meant we didn’t have to pivot when COVID-19 arrived.
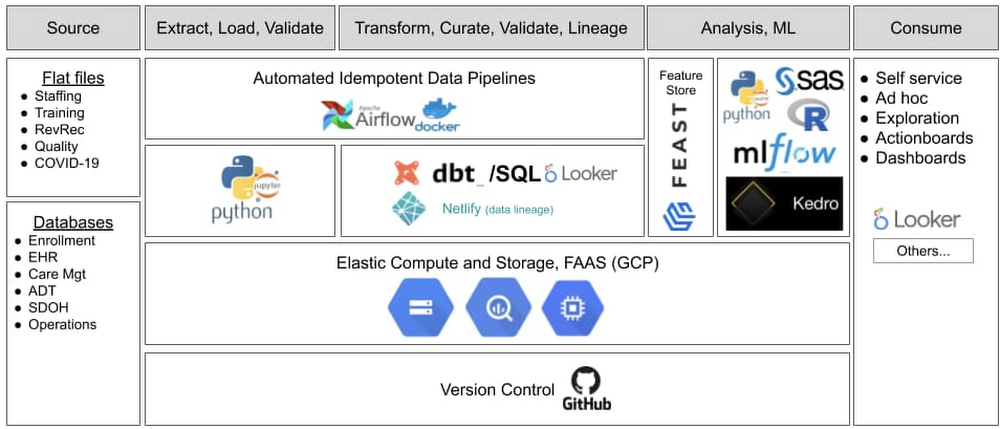
Our data science team used Looker and BigQuery in combination with other technologies (see figure below) to develop and deploy our data ops and ML ops capabilities. All of Google Cloud was available under a single business associate agreement (BAA) to meet HIPAA requirements and BigQuery was (and still is) elastic and available as a service. These two features made it easier for our small data science team to stay focused and move fast, while remaining compliant and enjoy great platform performance.
As we used query abstraction and a columnar-based data engine, we discovered an advantage during our response to the COVID-19 pandemic. We had a rapidly increasing number of ways to describe individual “things” combined with very rapid cycles to define “what mattered” at a moment of the day or week. We took advantage of the columnar format to pre-answer as many questions as possible and used straightforward query virtualization to quickly iterate on the idea of what clinicians wanted to see at the speed that they needed to see new or different data. Consequently, we could “move with” clinicians and provide data and predictive insights via general dashboards and role-specific dashboards called action boards. “Action boards” go beyond dashboards—they offer the information needed to help decide which action a clinician will take next, depending on the specific needs of each member.
Incorporating daily or even hourly data from various sources was essential to ensure our members got what they needed, whether home-delivered meals, medications, or another service. In some cases, we already had all the required data. For example, in less than 30 minutes, we implemented the CDC’s definition of high-risk for COVID-19 complications in LookML (Looker’s query abstraction layer) and linked the concept “high-risk COVID-19 complications” into our information model. Within a day, we built our main COVID-19 monitoring dashboards and infused relevant pandemic data into other clinical dashboards and action boards. The combination of concept flexibility via abstraction and wide delivery allowed us to quickly identify every member at high risk of a poor COVID-19 outcome and provide that knowledge to their assigned CCA clinicians and integrated care team.
Some of the data we needed wasn’t easily accessible—for example, at the time there wasn’t a repository of COVID-19 data or data services on GitHub. But it was essential that we incorporated all needed data to serve all our members—a data-omnivorous approach. In many cases, we had to gather the data ourselves. For example, in the early stages of the COVID-19 pandemic in Massachusetts, adult day health (ADH) centers, community centers that provide critical services for seniors, were closing one-by-one and then abruptly closed en masse. We were able to distribute that knowledge to each member’s assigned CCA clinician action board within minutes of learning of new ADH closings. At a later stage of the COVID-19 pandemic, we started to ingest Massachusetts Department of Public Health data describing test positivity rates to provide insights describing the concentration of high-risk members living in areas with high or escalating COVID-19 risk.
The journey from “just data” to “essential for care and support”
As the COVID-19 pandemic and its effects continue to evolve, we continually use the latest available information to update and guide our member support and care strategies. Our teams have become more comfortable using data. Typically, we have more than 450 weekly active users and, on average, someone looks at data nearly once every second during the workday. The questions have gotten more interesting and we’re able to ask more about how a piece of data fits, or doesn’t fit, into the member’s bigger picture. Instead of thinking of data as a separate factor, it fades away and becomes part of the surrounding context in which we see the person who is the member—just like how we don’t think specifically about GPS anymore, but rather we focus on the destination. Now the use of data is really built into the way we care for members--it’s part of daily routines.
With this kind of reliability, the data science team has moved on to deeper feature engineering and causal inference to enrich the insights delivered to our staff and clinicians. Additionally, our staff and clinicians have come to expect that data can help them take care of vulnerable people.
Retrospective for data-informed decisions
The road to data-informed decision making involves time to build trust in the system. COVID-19 helped solidify that trust and now our clinicians expect data to help toward the care of vulnerable members. We learned that you must build up the ability to quickly iterate to get the data and platform good enough (not perfect) to start being meaningful —and the technology has to allow for that iteration speed. As humans, we see what we know and when people don’t see the big picture or don’t have all the information, they may make near-sighted or counterproductive choices. They can fall into habits or heuristics that reinforce existing problems.
Now we’re dealing with human-to-machine interactions as well as human-to-data interactions. When we get it right, we start to incorporate data into our decision making without adding another step. Eventually, it’s just a natural part of the decision process—in this case to take care of a person. For example, evaluation of chest pain frequently requires an electrocardiogram (ECG) interpretation, which encapsulates a large amount of data, and clinicians expect an ECG to help them take better care of the person vs. focusing on the data itself.
The COVID-19 pandemic showed us that data used in the right way can extend the human touch and become a therapeutic ally.
You can learn more about CCA in our JOIN@Home session and the full case study.