How BigQuery helps scale and automate insights for baseball fans
Alok Pattani
Data Science Developer Advocate
When looking at data, business decision makers are often blocked by an intermediate question of "What should I take away from this data?" Beyond putting together the numbers and building the results, data analysts and data scientists play a critical role in helping answer this question.
Organizations big and small depend on data analysts and data scientists to help “translate from words to numbers, and then back to words” as sports analytics pioneer Dean Oliver once said. But beyond creating tables, graphs, and even interactive dashboards for their audience, data scientists and analysts often need to be able to automate further the communication piece, delivering faster, more clear insights for the business.
Data cloud solutions like BigQuery help data practitioners scale and automate their analysis and accelerate their time to insight. With BigQuery’s self-tuning, serverless infrastructure, data analysts are empowered to focus on their analytics without worrying about infrastructure management, as IT operations are automated. Enabling analysts and saving them time in this way allows shifting resources, perhaps to finding the stats or trends that may not be as easily automated, as well as building out more metrics to be made available for the automated insight generation pipeline.
In a previous post, we gave an overview of how Major League Baseball (MLB) partnered with Google Cloud to scale its process of generating “game notes”—statistical insights related to players or teams involved in a particular matchup. With the 2021 MLB season upon us, we’ll go into further detail on how various BigQuery functionality comes together in the process to automate the creation of game notes from Statcast data. We’ll discuss how to go from relatively raw data in BigQuery to hundreds or thousands of insights consisting of a sentence, picture, and contextual table like the ones in the original post.
While baseball serves as a fun playground, parts of the process outlined here can be used across all industries that have big data and want to turn it into timely, contextual, succinct bits of valuable information with vastly improved efficiency relying on automation. Let’s step up to the plate…
Construct a Repeatable Pattern for Certain Types of Insights
Before going into the technical aspects, it’s important to think about which forms of insights can be automated and scaled from the given data, and how. In the MLB case, “stat leaderboard”-type notes like the one above can be thought of as compositions of a few elements:
A statistic of interest, e.g. number of hard-hit balls or average fastball velocity.
A time span that the leaderboard covers, e.g. last 2 regular seasons or this postseason.
An “entity” of interest, usually either teams or players.
A “facet” of the game, representing which “side” of the ball to calculate certain stats for, e.g. hitting or pitching.
A ranking qualification criteria, which represents a minimum # of opportunities for a stat to be reasonable for ranking (mostly used for player “rate” stats where a small denominator can lead to outlier results, like a .700 batting average over 10 at-bats).
Putting together these pieces can give a lot of potential notes, and then we can use some “impressiveness” criteria (e.g. if the player ranks in the Top 5 or 10) and relevance criteria (e.g. is the player’s team involved in an upcoming game?) to surface interesting notes and attach them to games. Without automation, an MLB content expert could generate some of the same game notes with tools like Baseball Savant, but would have to run dozens of manual searches looking for specific players or teams, find ones that actually have that entity in the top 5 or 10, and then manually type out the note text and/or accompanying table. Even if each note only takes a few minutes to generate, that can easily add up to several hours when trying to cover multiple players across all 30 teams.
Set Up Metrics Metadata in Tables
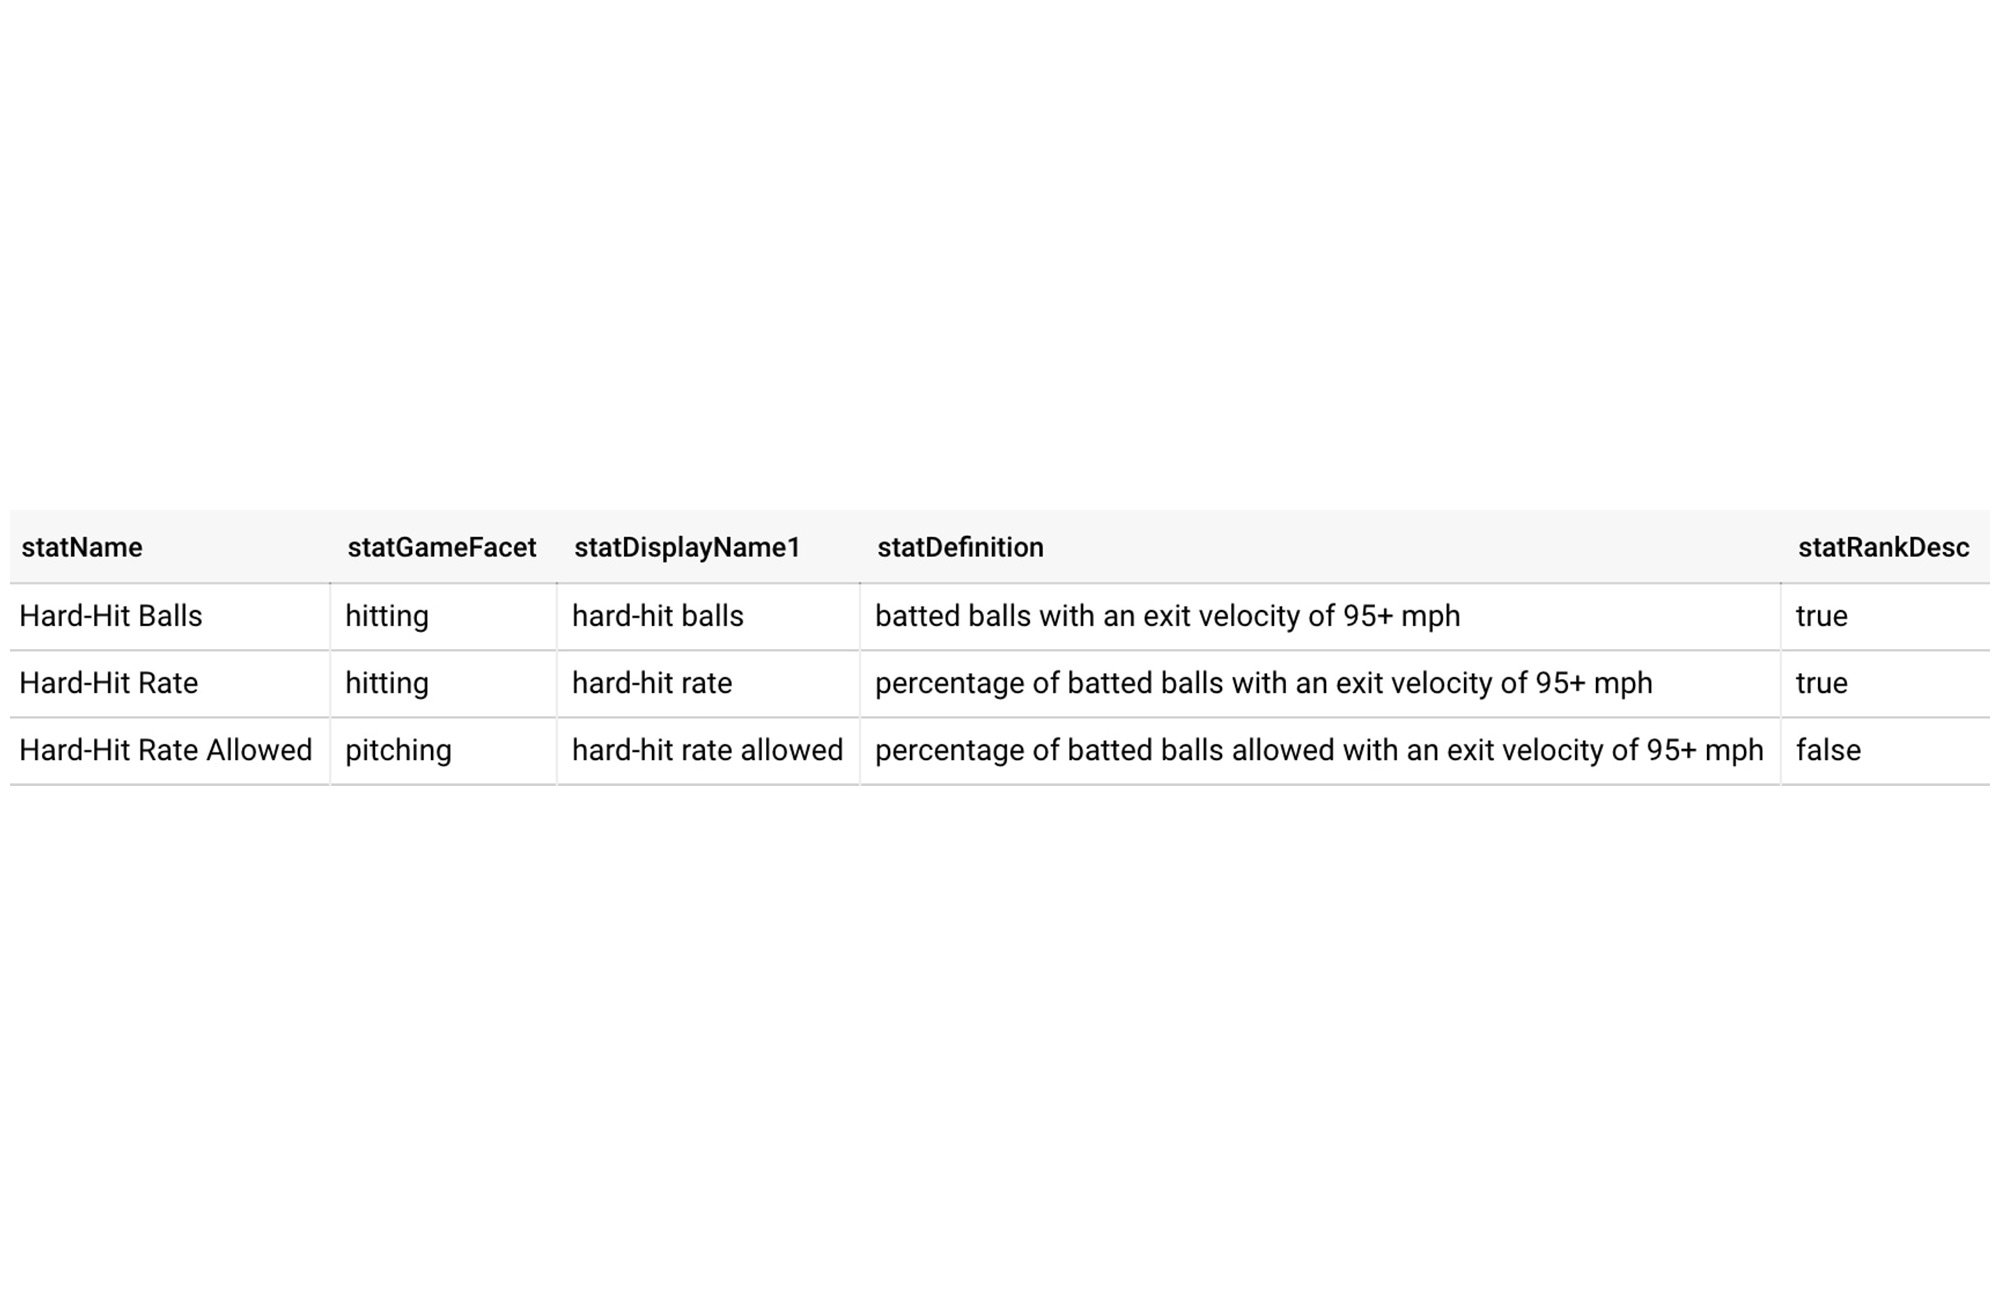
In addition to tables that hold the actual data from which insights are to be derived, it’s helpful to set up BigQuery tables that contain “metadata” about some of the composable elements that form the insights. In the MLB game notes case, one of these tables has information about each statistic (e.g. “Hard-Hit Rate”) that is considered for a game note, like its display names, definition, and whether ascending or descending ranking is “good” for that stat.
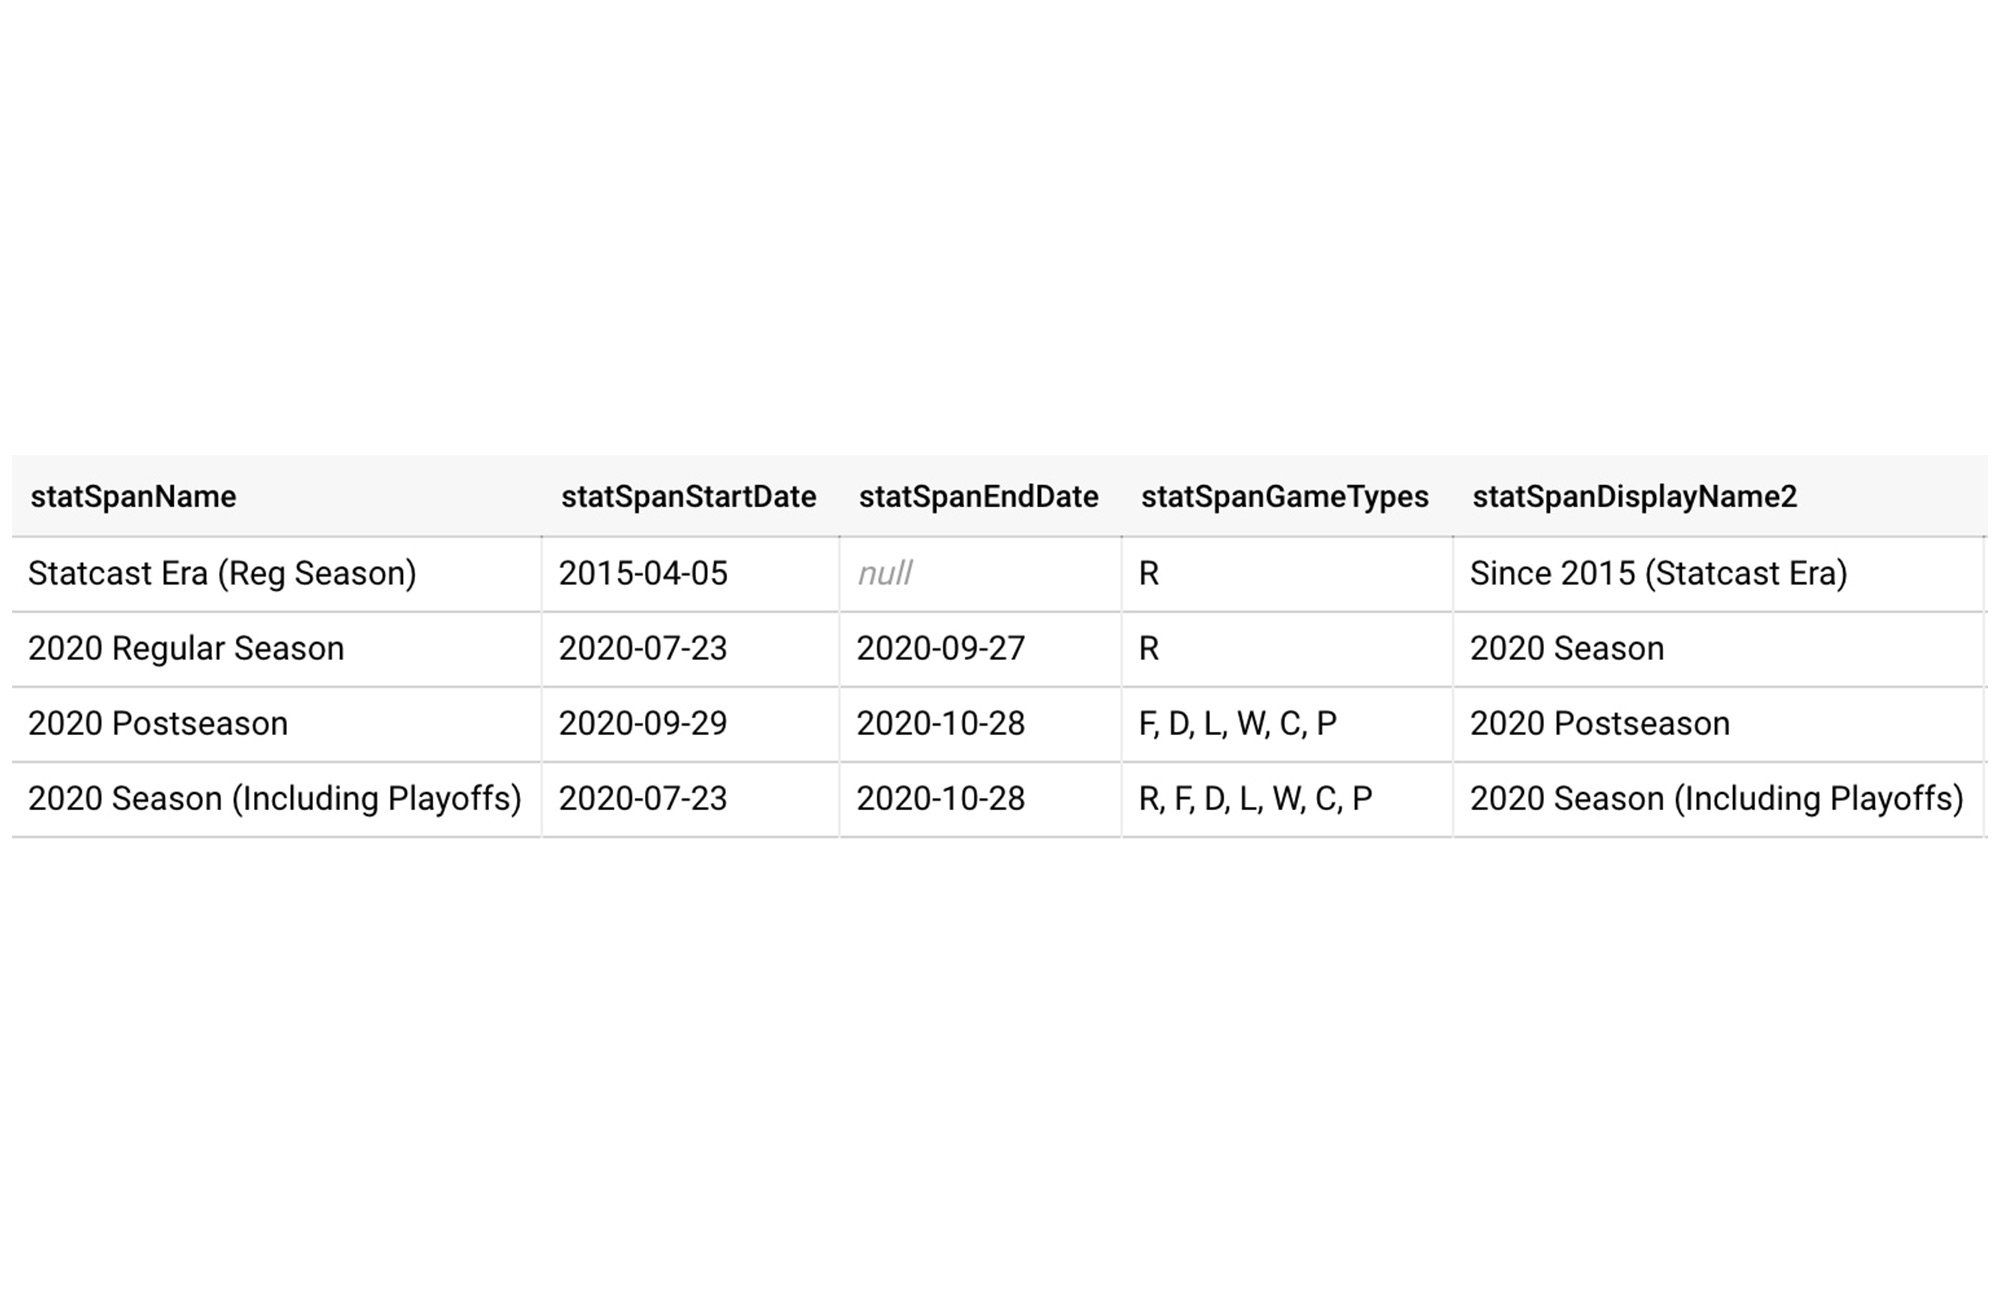
Another metadata table has information about each span (e.g. “2020 postseason”) for which notes can be constructed, including relevant dates and game types.
These tables are used in various pieces of the note generation process—filtering data to the correct dates by span, ranking players or teams in each stat the correct way, and having consistent text to use in both the sentences and tables that comprise the final notes.
Create Views to Filter and Prepare Specific Data for Repeated Use
Another way to modularize some aspects of the insight generation process is to use BigQuery views. In some analytics workflows, views can be used to store results of certain queries that are intermediaries for multiple other steps. Since views are virtual, sitting “on top” of tables (or other views), they are always fresh with the latest data in the underlying tables. Compared to a batch-oriented ETL system (e.g. one replying on MapReduce), using BigQuery tables and views together is more efficient in modularizing intermediate data processing steps like these.
In the MLB game notes code, there are views that filter pitch-level event data to specific spans, like the one below for the 2020 postseason.
We also employ more complex views that get each team’s next scheduled game (so we know which games are available to “attach” notes to), the updated roster for each team (so we know which players are on which teams), and as intermediate steps in the note creation process outlined below. Big picture, views serve as versatile building blocks in various pieces of the insight generation process.
Use Temporary Tables and Dynamic SQL for Intermediate Outputs
Eventually, the insight generation process moves to steps that can be executed with a series of SQL queries—some repetitive, but different enough that they can’t just be 1 big query, others relying on similar logic but applied to parallel tables. BigQuery features like temporary tables and dynamic SQL are useful in executing these steps while reducing the amount of unnecessary data being stored and potentially duplicative code to manage. When going from automating notes off a few stats to a couple dozen to over one hundred, being able to add new stats or spans with minimal code changes—i.e., not one new SQL query per stat—is extremely valuable.
One example incorporating both concepts from the MLB game notes generation process is the following dynamic SQL statement. This creates a temporary table SpanSituationEvents from a variable SPAN_SITUATION_EVENTS_TABLE that is a string representing the name of a specific table (or view) with pitch-level data:
This piece of code is used to turn data on a set of particular table of events—think of the 2020 postseason view described above—and then instantiates it as a table that can be referred to multiple times within a script, but doesn’t need to exist outside the script (hence, temporary).
Dynamic SQL allows us to use table names as variables, getting around restrictions of BigQuery parameters, which don’t allow this. Multiple SQL queries of the same form referring to different tables (in this case, different sets of MLB events) can be represented in a single pattern. This process of “using code to generate SQL” is a key technique in many data science projects, often done in Python or R. One advantage of using dynamic SQL in BigQuery—i.e. using SQL to write SQL—is that everything can be written “in one place,” without having to rely on other languages, environments, client libraries, etc.
Use Scripting and Stored Procedures to Implement More Complex Business Logic
As we dive deeper into the code to generate insights, the business logic can become more intricate to generalize over different types of metrics (ratios, sums, more complex calculations) and different levels of aggregation. Instead of writing a separate query for each one of the metrics and aggregation levels under consideration, we can use BigQuery scripting and stored procedures to write SQL “templates” that keep as much as possible the same, while using variables and control flow to handle different use cases of queries with the same fundamental structure. Used in this way, stored procedures are a SQL-based way of using functional programming to modularize and string together pieces of a bigger algorithm.
In the case of calculating various stats to be used in MLB game notes, there are “counting” stats that are cumulative, summing over a single field (e.g. hard-hit balls), and there are “rate” stats that involve summing a numerator and denominator (e.g. hard-hit rate) and other further filtering by a qualification criteria (e.g. minimum 75 batted balls). Stats for pitchers should be aggregated over the “pitcherId” field; stats for hitters (sometimes the same stats, just from the opposite perspective) should be aggregated over the “hitterId” field. Generalizing this format of calculation was achieved by using a large stored procedure, the beginning of which is shown below.
The snippet below shows how the ENTITY_TYPE and STAT_GAME_FACET fields are used in a multi-level case statement to allow aggregation of any stat to either the team or player level, as well as from the pitching or hitting side.
The actual procedure takes up a couple hundred lines of code, and makes use of dynamic SQL and temporary tables as mentioned above. It was constructed in such a way to generalize the calculation of dozens of “parallel” stat leaderboards, and enables the calculation and storage of various stat leaderboards in “long” format as opposed to “wide” format. Storing each player or team stat on its own row, as opposed to multiple stats for a given player or team on the same row (as in “traditional” sports statistics displays), enables subsequent steps like ranking and note generation to proceed more seamlessly within BigQuery (essentially, “stat leaderboard” becomes another “GROUP BY” variable).
Like functions in other languages, BigQuery stored procedures can be nested and chained together, enabling the execution of complex data pipelines from directly within the data warehouse. In the MLB game notes case, a procedure called “run_stat_combo_calcs” takes a set of stat leaderboards to calculate, runs the “calc_stat_span_situation” procedure referenced above over 100 times (once per leaderboard), then passes the resulting “long” table to a function that adds all rankings and uploads the resulting table into BigQuery for additional processing.
Create Contextual Ranking Info Using Arrays and Structs
A long table with entities (teams or players), stats, and rankings can be joined with the metadata tables with stat/span information and the team roster view (both referenced above) to create the “sentence” piece of many game notes. An additional piece of context that can be useful—perhaps more often in sports, but not exclusive to that realm—is a table showing the entity of interest along with others around that entity in the rankings. Using a direct MLB example, if a player ranks second in a given stat, it’s interesting to see a table of who ranks first, third, maybe even the entire top five or ten.
From a BigQuery standpoint, generating this part requires going back into the long leaderboard table and getting more than just the info present on the single row for one team or player—we need the other entities “around” them. The implementation to get that information from “surrounding” rows is enabled by using BigQuery’s array functionality, including arrays of structs. To demonstrate with some stripped down “pseudo-code” from the game notes generation process:
This query aggregates to 1 row per stat leaderboard (e.g. hard-hit ball leaders on a given date), nesting the player or teams that rank in the top or bottom 5 or 10 of a given leaderboard in an array. The array is made up of structs, a record format that allows multiple fields to be stored together—in this case, each entity’s rankings, id, name, current team, and formatted stat value comprise a single record in the array. By nesting in this way, we preserve elements of each stat leaderboard that might be useful in final note generation, without aggregating them to a strictly text format that would be more difficult to work with downstream.
When joining the stat leaderboard table with the array back to the table with 1 row per individual stat, we can then unnest the elements of the array and use them dynamically—specifically, we modify the leaderboard table to look different for each individual on that leaderboard. One piece in our game notes example is the highlight (via “**”) of the actual player’s row in the table since it’s his note. The same dynamic “join and unnest” can restrict the leaderboard table to a different number of rows depending on where the player in the note ranks.
Putting arrays and structs together allows us to use both nested and unnested forms of the same data to add this extra context to game notes in a scalable way. Big picture, investing time to understand BigQuery’s array and struct functionality can pay off with relatively compact code to create some truly unique output.
Scoring and Ranking Insights Using Different Criteria
Once our automation to turn data into insights starts going, a new problem can emerge: too many insights, with no way to understand which are more interesting or relevant than others. If we want to condense the data to a few key messages with visuals, having too many “key” messages can be counter to the original point of extracting the top takeaways.
In our MLB game notes example, there are some clear pieces within the data that can help with ranking importance—e.g. ranking 2nd in a stat with 500 qualifiers is probably more interesting than ranking 7th in a stat with 30 qualifiers. BigQuery’s rank and percentile rank functions are helpful in creating the “stat interest” score used as a major component for notes.
Often, there are exogenous factors that may influence how valuable a given insight is. In scoring the quality of our MLB game notes, we also incorporated some metrics of the player or team’s popularity, for example (see the original piece for more detail). In more traditional business contexts, there may be some segments that are of greater importance than others, or certain top-level KPIs that are worthy of more focus. Therefore, improving scoring and ranking insights is likely going to be business-specific and highly dependent on user feedback.
There are pieces that can be built into the insight generation code and data in BigQuery that more easily allow tweaking and understanding what leads to better insights. In the MLB case, we stored info on which stats were thought to be more important as numbers in those metadata tables referenced above (e.g. “Hard-Hit Rate” has a higher interest score than “Average HR Launch Angle”, the 2020 postseason has a higher relevance score than the 2019 season). BigQuery parameters can also be employed to allow similar scoring flexibility without having to manually modify hardcoded SQL to make changes.
Putting Everything Together and Final Delivery
While glossing over a few pieces, we’ve covered some key details and BigQuery functionality that allow us to create insights in an automated fashion. By the end of the 2020 MLB season, we were able to generate dozens of interesting game notes per team, meaning hundreds of notes on a typical day with multiple games being played. And the system put in place allows even further scaling—if we wanted to add more stats or spans for note consideration, we could do so with fairly small additions to the metadata tables and code. The system would chug along and create even more game notes following the same pattern.
The last step is to take those insights we’ve created and “deliver” them to end users in a form that is useful to them. In the MLB game notes example, we created a Data Studio dashboard that sits on top of the final BigQuery table with game notes, corresponding metadata, and score information. The dashboard shows a ranked list of notes in text form, along with the accompanying tables and note scores for a single note (see our previous post for more details).
While there is some circuitousness here (wasn’t the idea to take insights out of a dashboard?), the key difference is that this dashboard contains text-based insights, not large tables of data from which users are left to draw their own conclusions. Filters allow users to focus only on specific games or players or particular types of stats. Custom note scoring is enabled using Data Studio parameters, so users can upweight or downweight different components and get a more customized ranking of insights.
Other presentations or packaging of insights like game notes—PDFs, graphics, email—are of course possible, using other Google Cloud tools. Like insight scoring, a lot of this will be business- and user-specific—perhaps the “notes” are delivered by business segment on a regular basis via a scheduled report, or only insights that reach a certain threshold are delivered on a regular basis (similar to anomaly detection).
The vision here was to use the creation of MLB game notes using BigQuery to illustrate how data professionals across industries might think about scaling their own processes for generating insights from data. Hopefully by showing how we automated the generation of interesting facts about baseball players on the field, we can help you have more impact in your field!
Major League Baseball trademarks and copyrights are used with permission of Major League Baseball. Visit MLB.com.