Taking a practical approach to BigQuery slot usage analysis
Marco Tranquillin
Customer Engineering Manager for Data Analytics
Google BigQuery is a fully managed serverless solution for your enterprise data warehouse workloads. Nothing could be easier than that: Just upload your data via batch or streaming and start running your queries. The underlying system will seamlessly take care of providing the infrastructural resources needed to complete your different jobs.
It seems like magic, right? Especially when you think about the fact that, behind the scenes, there is a large-scale distributed system with a multitude of parallel tasks executed by dozens of microservices spread across several availability zones across your selected Google Cloud region (find more details about BigQuery technology).
But what if you want more visibility into the power under the hood? In this blog post, we’ll dive into all the currently available options to monitor and analyze resource usage. We’ll also describe the newly available extension to INFORMATION_SCHEMA views, now in beta, that offers you practical access to the underlying data. Let’s start by exploring the computational capacity unit we use to understand the load of the system.
BigQuery’s computational capacity unit: the slot
Every time you perform a query, there are several back-end tasks that need to be completed (such as reading data from tables, pruning data that is not useful anymore, performing eventual aggregations, etc.). Each task, executed on an ad-hoc microservice, requires an adequate amount of computational power in order to be fulfilled. The slot is the computational capacity unit to measure that power. The BigQuery engine dynamically identifies the amount of slots needed to perform a single query, and background processes will transparently allocate the adequate computation power needed to accomplish the task.
So, it’s essential to understand how to monitor and analyze slot usage, because that lets your technical team understand if there are any bottlenecks, then allows the business to choose the best pricing model (on-demand vs. flat-rate).
We’ll now analyze three different strategies to gain better visibility of slot usage and see how you can get started using them:
Slot usage analysis with system tables
Real-time usage monitoring with Stackdriver
Slot usage analysis with BigQuery audit logs
Slot usage analysis with system tables
We’re announcing an extended version of INFORMATION_SCHEMA views that contain real-time information about BigQuery jobs.
This is part of our internal series of views, called INFORMATION_SCHEMA, that lets you extract useful information related to datasets, routines, tables and views. With a simple query, you can access a series of metadata that facilitate the analysis of the current data warehouse definition (i.e., tables list, descriptions of the fields, etc).
This new extended version makes it easier to analyze slot usage (and other resources as well) because all the jobs information needed is just a query away.
Here’s an example. Let’s assume that you want to understand last month’s daily consumption of slots split by users (all together with other information) within a single project. The query you have to write is really simple:
The pivotal element here is total_slot_ms field, which contains the total amount of slots per millisecond used by a query. That’s the total number of slots consumed by the query over its entire execution time, considered in milliseconds. If you want to compute the average slot usage of the query, divide the value by the milliseconds duration of the query. You can do that by subtracting the value of endTime field from creationTime field. For example, if you have a 10-second query that used 20,000 totalSlotMs, it means that the average slot usage is 2: 20.000/10*1000.
If you continue digging into the column definitions of the views, you will find a lot of information that will enable you to implement different kinds of analysis. You can, for example, easily compute the most expensive queries within your organization, find users who are heavily issuing queries, understand what the most expensive projects are, and also perform deep analysis on single queries by studying their query stages. Since details are available within one second of the job completion, you can use that information to implement your own triggers (e.g., once a load job has been successfully completed, launch the query to clean and transform the data for production usage).
Note that the data is typically available within seconds, and jobs data is retained for a period of 180 days. If you want to maintain a backup of the data for historical reasons or to perform analysis later, use scheduled queries to automate the export of the data in an ad-hoc (partitioned) table. And keep in mind that real-time slot usage can fluctuate over the runtime of a query. To get deeper into the details, try this open-source solution to visualize slots consumption.
Real-time slot usage monitoring with Stackdriver
If you want instead to monitor in real time the slot usage of your project, Stackdriver is the place to go. It lets you:
Have an immediate overview of the project slot usage, thanks to the native slot utilization chart
Create ad-hoc charts using several available metrics (i.e., slots allocated or slots allocated per job type)
Create ad-hoc alerts to receive notifications when a certain event occurs (i.e., when the number of available slots is under a certain threshold for more than five minutes)
Check out this guide on implementing monitoring for BigQuery
https://cloud.google.com/bigquery/docs/monitoring
.
Slot usage analysis with BigQuery audit logs
Another possible option to get access to the underlying information is exploring BigQuery audit logs. These logs contain a multitude of information, including slot usage.
You have two ways to query the data:
Stackdriver Logging, if you want to perform a quick search of a precise value of interest
BigQuery, if you want to perform a more in-depth analysis
Stackdriver Logging
From the Stackdriver Logging page;
Select BigQuery as resource: resource_type=”bigquery_project”
Select the desired time frame (such as last hour or no limit)
Search for the ones containing
protoPayload.metadata.jobChange.job.jobConfig.type=”QUERY”
protoPayload.metadata.jobChange.job.jobStatus.jobState=”DONE”
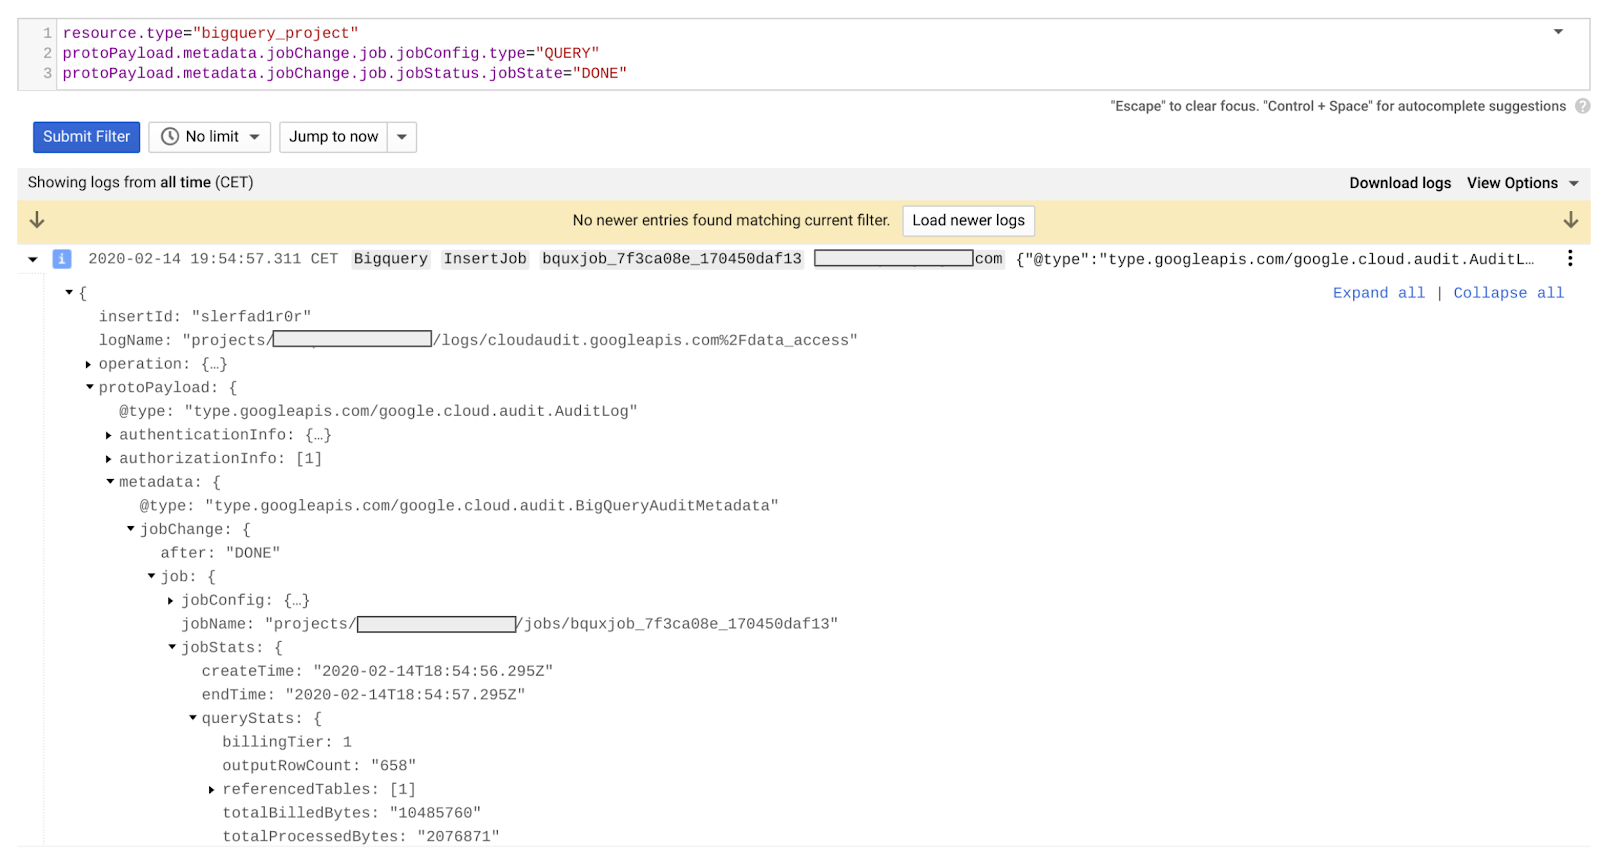
Once you’ve found the query you were looking for, expand its payload and look for the entry of interest. For example, $.jobChange.job.jobStats.totalSlotMs represents the total amount of slots-ms as described earlier.
If you want to perform more in-depth analysis, you can use BigQuery. First, create a sink to transfer the data from Stackdriver Logging to BigQuery. Then you can perform more complex queries to analyze the slot usage of your project. For example, if you use the same query as above, this will be the outcome:
We’re excited to see how you’ll use these tools to build your customized solution. Learn more here about organizing slots. And your next step might be to use Data Studio to generate custom dashboards to be shared within your organization.