Real-time diagnostics from nanopore DNA sequencers on Google Cloud
Allen Day
Developer Advocate, Digital Assets at Google Cloud
Lachlan Coin
University of Queensland
In a healthcare setting, being able to access data quickly is vital. For example, a sepsis patient’s survival rate decreases by 4% for every hour we fail to diagnose the species causing the infection and and intervene with an appropriate antibiotic regimen [1,2].
Typical genomic analyses are too slow. You transport DNA samples from the collection point to a centralized facility to be sequenced and analyzed in a batch process, which can take weeks or even months. Recently, nanopore DNA sequencers have become commercially available that stream raw signal-level data as they are collected and provide immediate access to them. However, processing the data in real-time remains challenging, requiring substantial compute and storage resources, as well as a dedicated bioinformatician. Not only is the process still too slow, it’s also failure-prone, expensive, and doesn’t scale.
We recently built out a proof of concept for genomics researchers and bioinformatics developers that highlights the breadth and depth of Google Cloud’s data processing tools. In this article we describe a scalable, reliable, and cost effective end-to-end pipeline for fast DNA sequence analysis built on Google Cloud and this new class of nanopore DNA sequencers.
We envision four scenarios that can use this application, specifically to detect biocontaminants:
- Medical professionals
- Veterinary clinics
- Agronomists
- Biosecurity professionals
In all cases, analytical results are made available in a dynamic dashboard for immediate insight, decision-making, and action.
Here’s a video of the University of Queensland's application performing real-time analysis of DNA nanopore sequencer data:
How the research team built it
The team’s primary concern while building this system was to shorten the time between when the data is uploaded from the sequencer and when results are available.
To keep things fast on the client-side, the team implemented a dynamic dashboard with D3.js, which periodically polls a database for new data and updates the chart accordingly. More specifically, they based their visualization on Sunburst. Server-side, they used Firebase, a document-storage system that can represent hierarchical data (necessary to represent biological taxonomies) and that is designed with web and mobile developers in mind. You can find all the code in the GitHub nanostream-dataflow project.
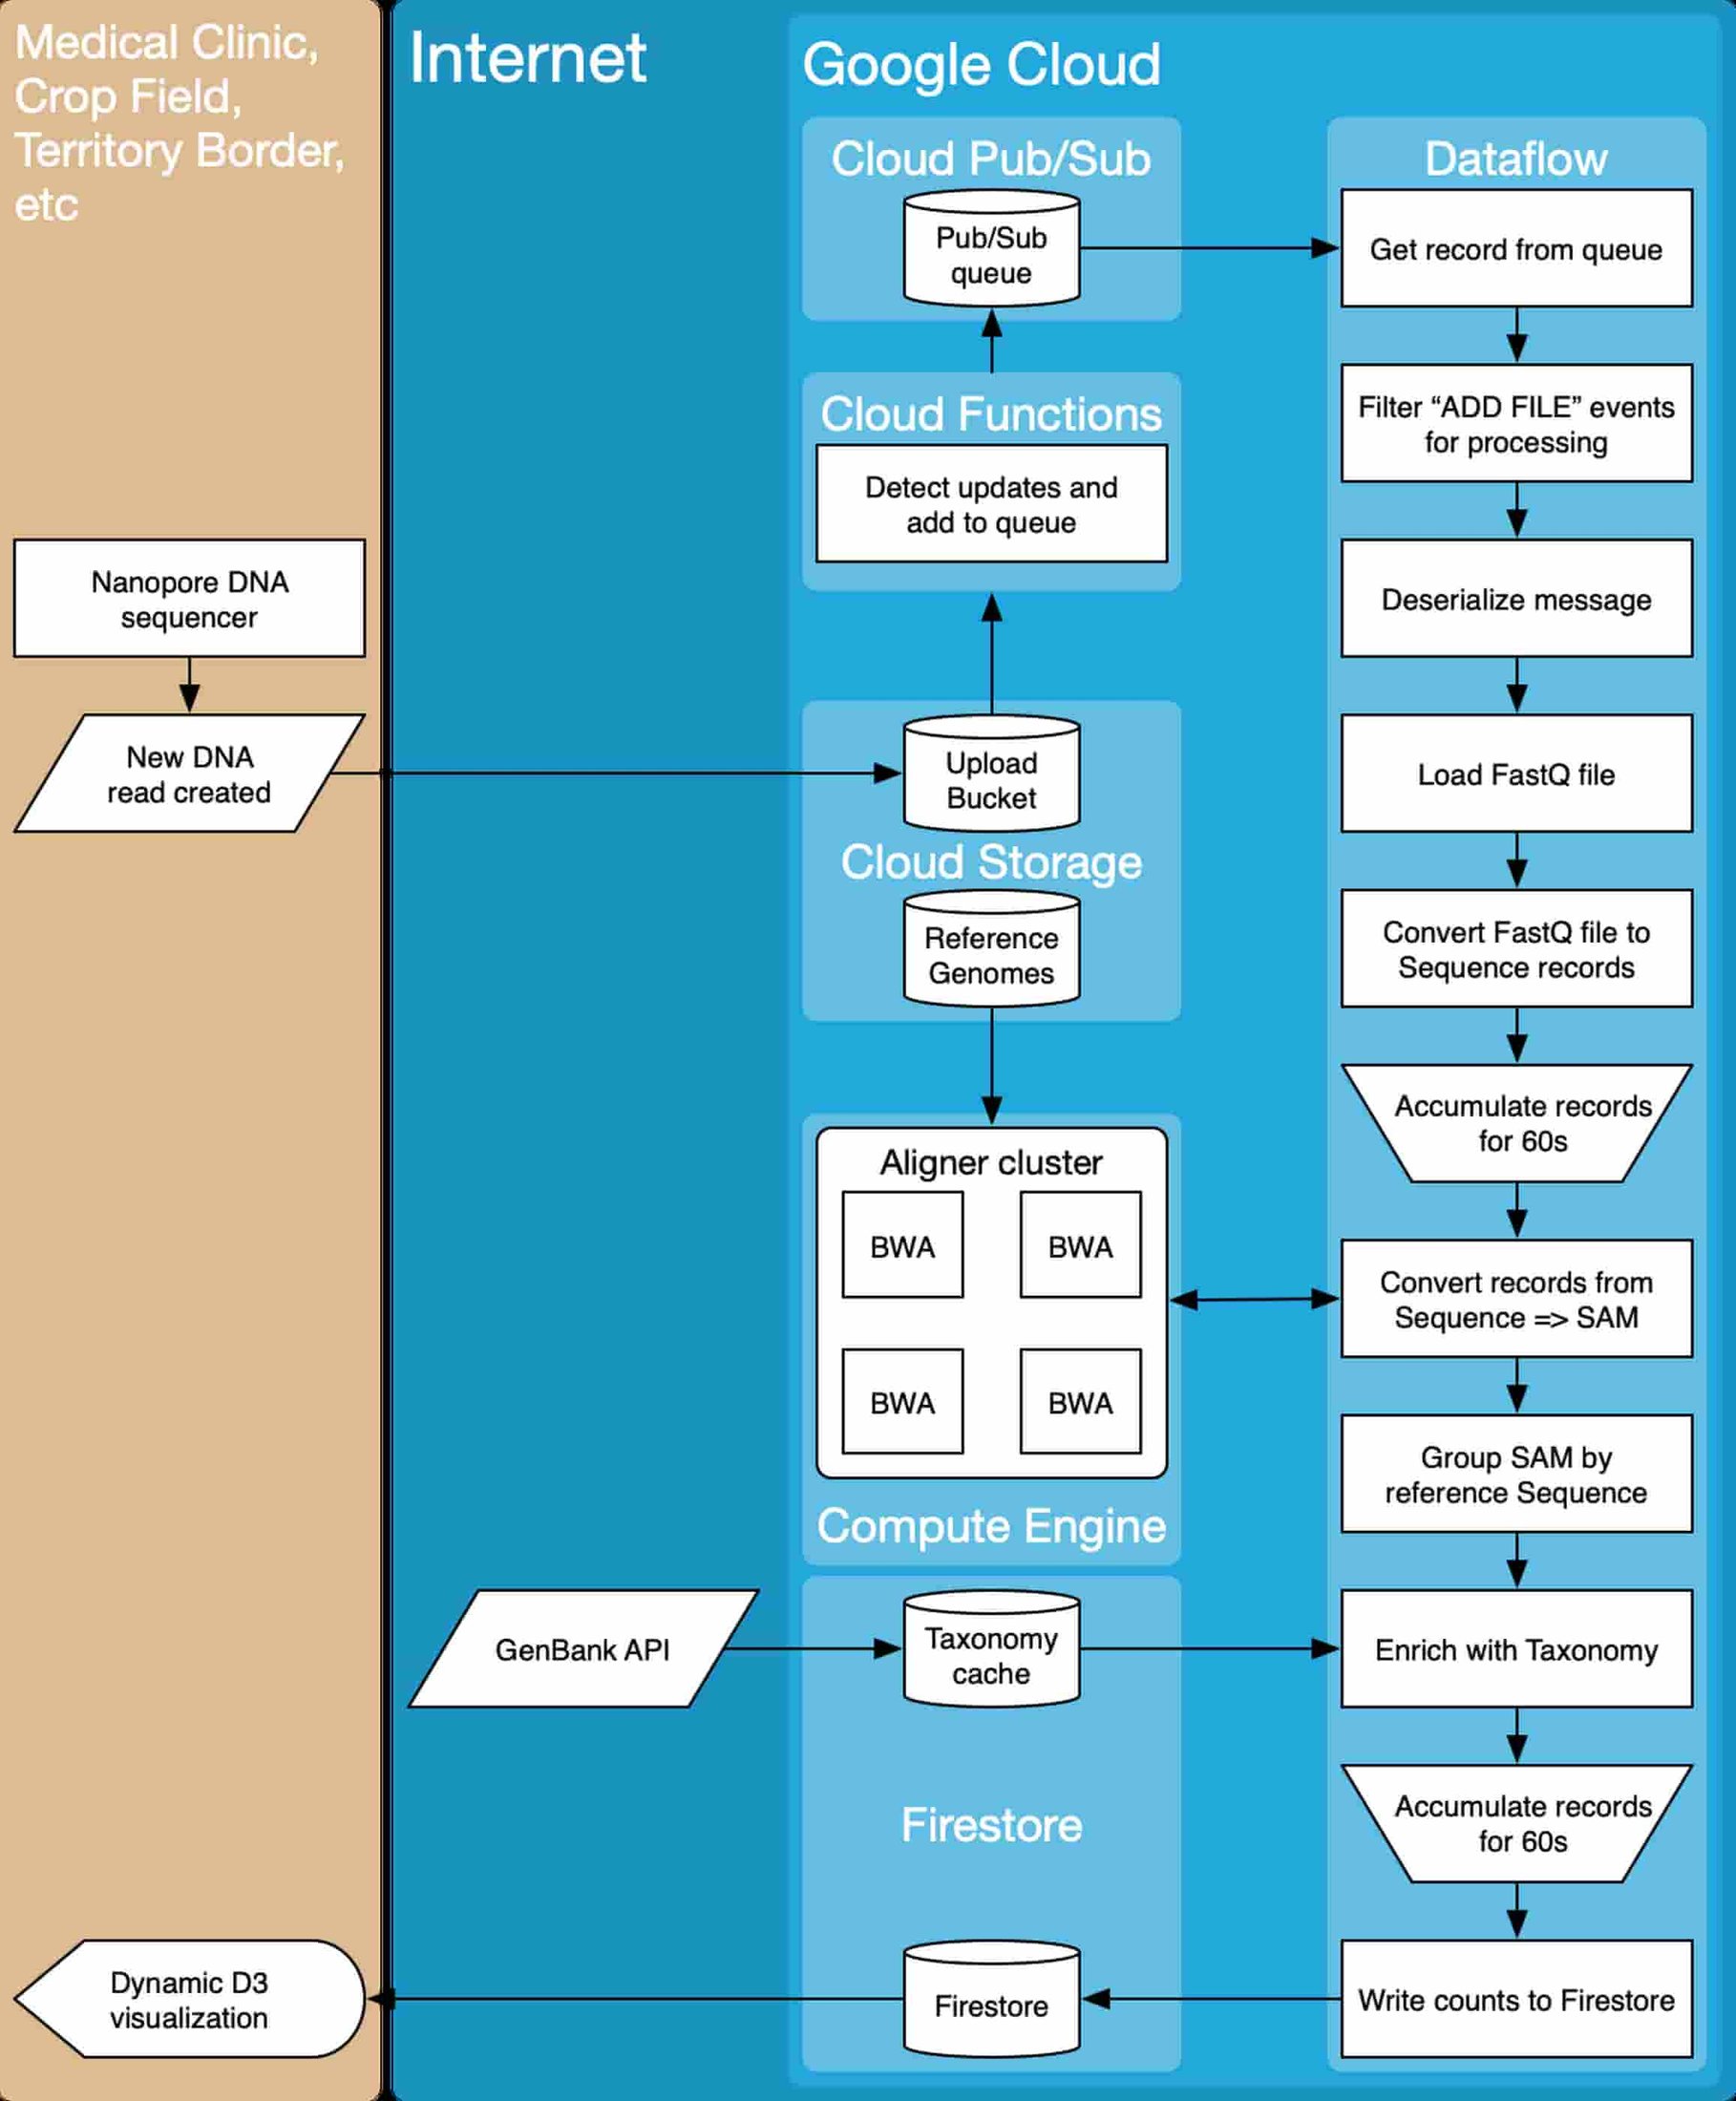
From a system architecture perspective, the team relied on a variety of Google Cloud Platform compute, storage and data processing tools. Data are collected from a nanopore DNA sequencer, and as data become available (New DNA read created), they are uploaded to a Cloud Storage bucket (Upload Bucket). As files are uploaded, they are ingested into a workflow that converts the input files into actionable reports (Dynamic D3 Visualization).
The team made extensive use of the Apache Beam library to implement the data processing logic. Beam workflows can be run on Google Cloud Dataflow, which makes integration with other Google Cloud services easy. The team used Compute Engine to build the auto-scaling Alignment Cluster (here’s a codelab), and Firebase for visualization.
Use cases
The possibilities for real-time DNA sequencing are endless. Here are a few that the team tested, and others that we imagine.
1. Dog bite infection diagnosis from a blood sample: a clinical use case for taxonomical counting
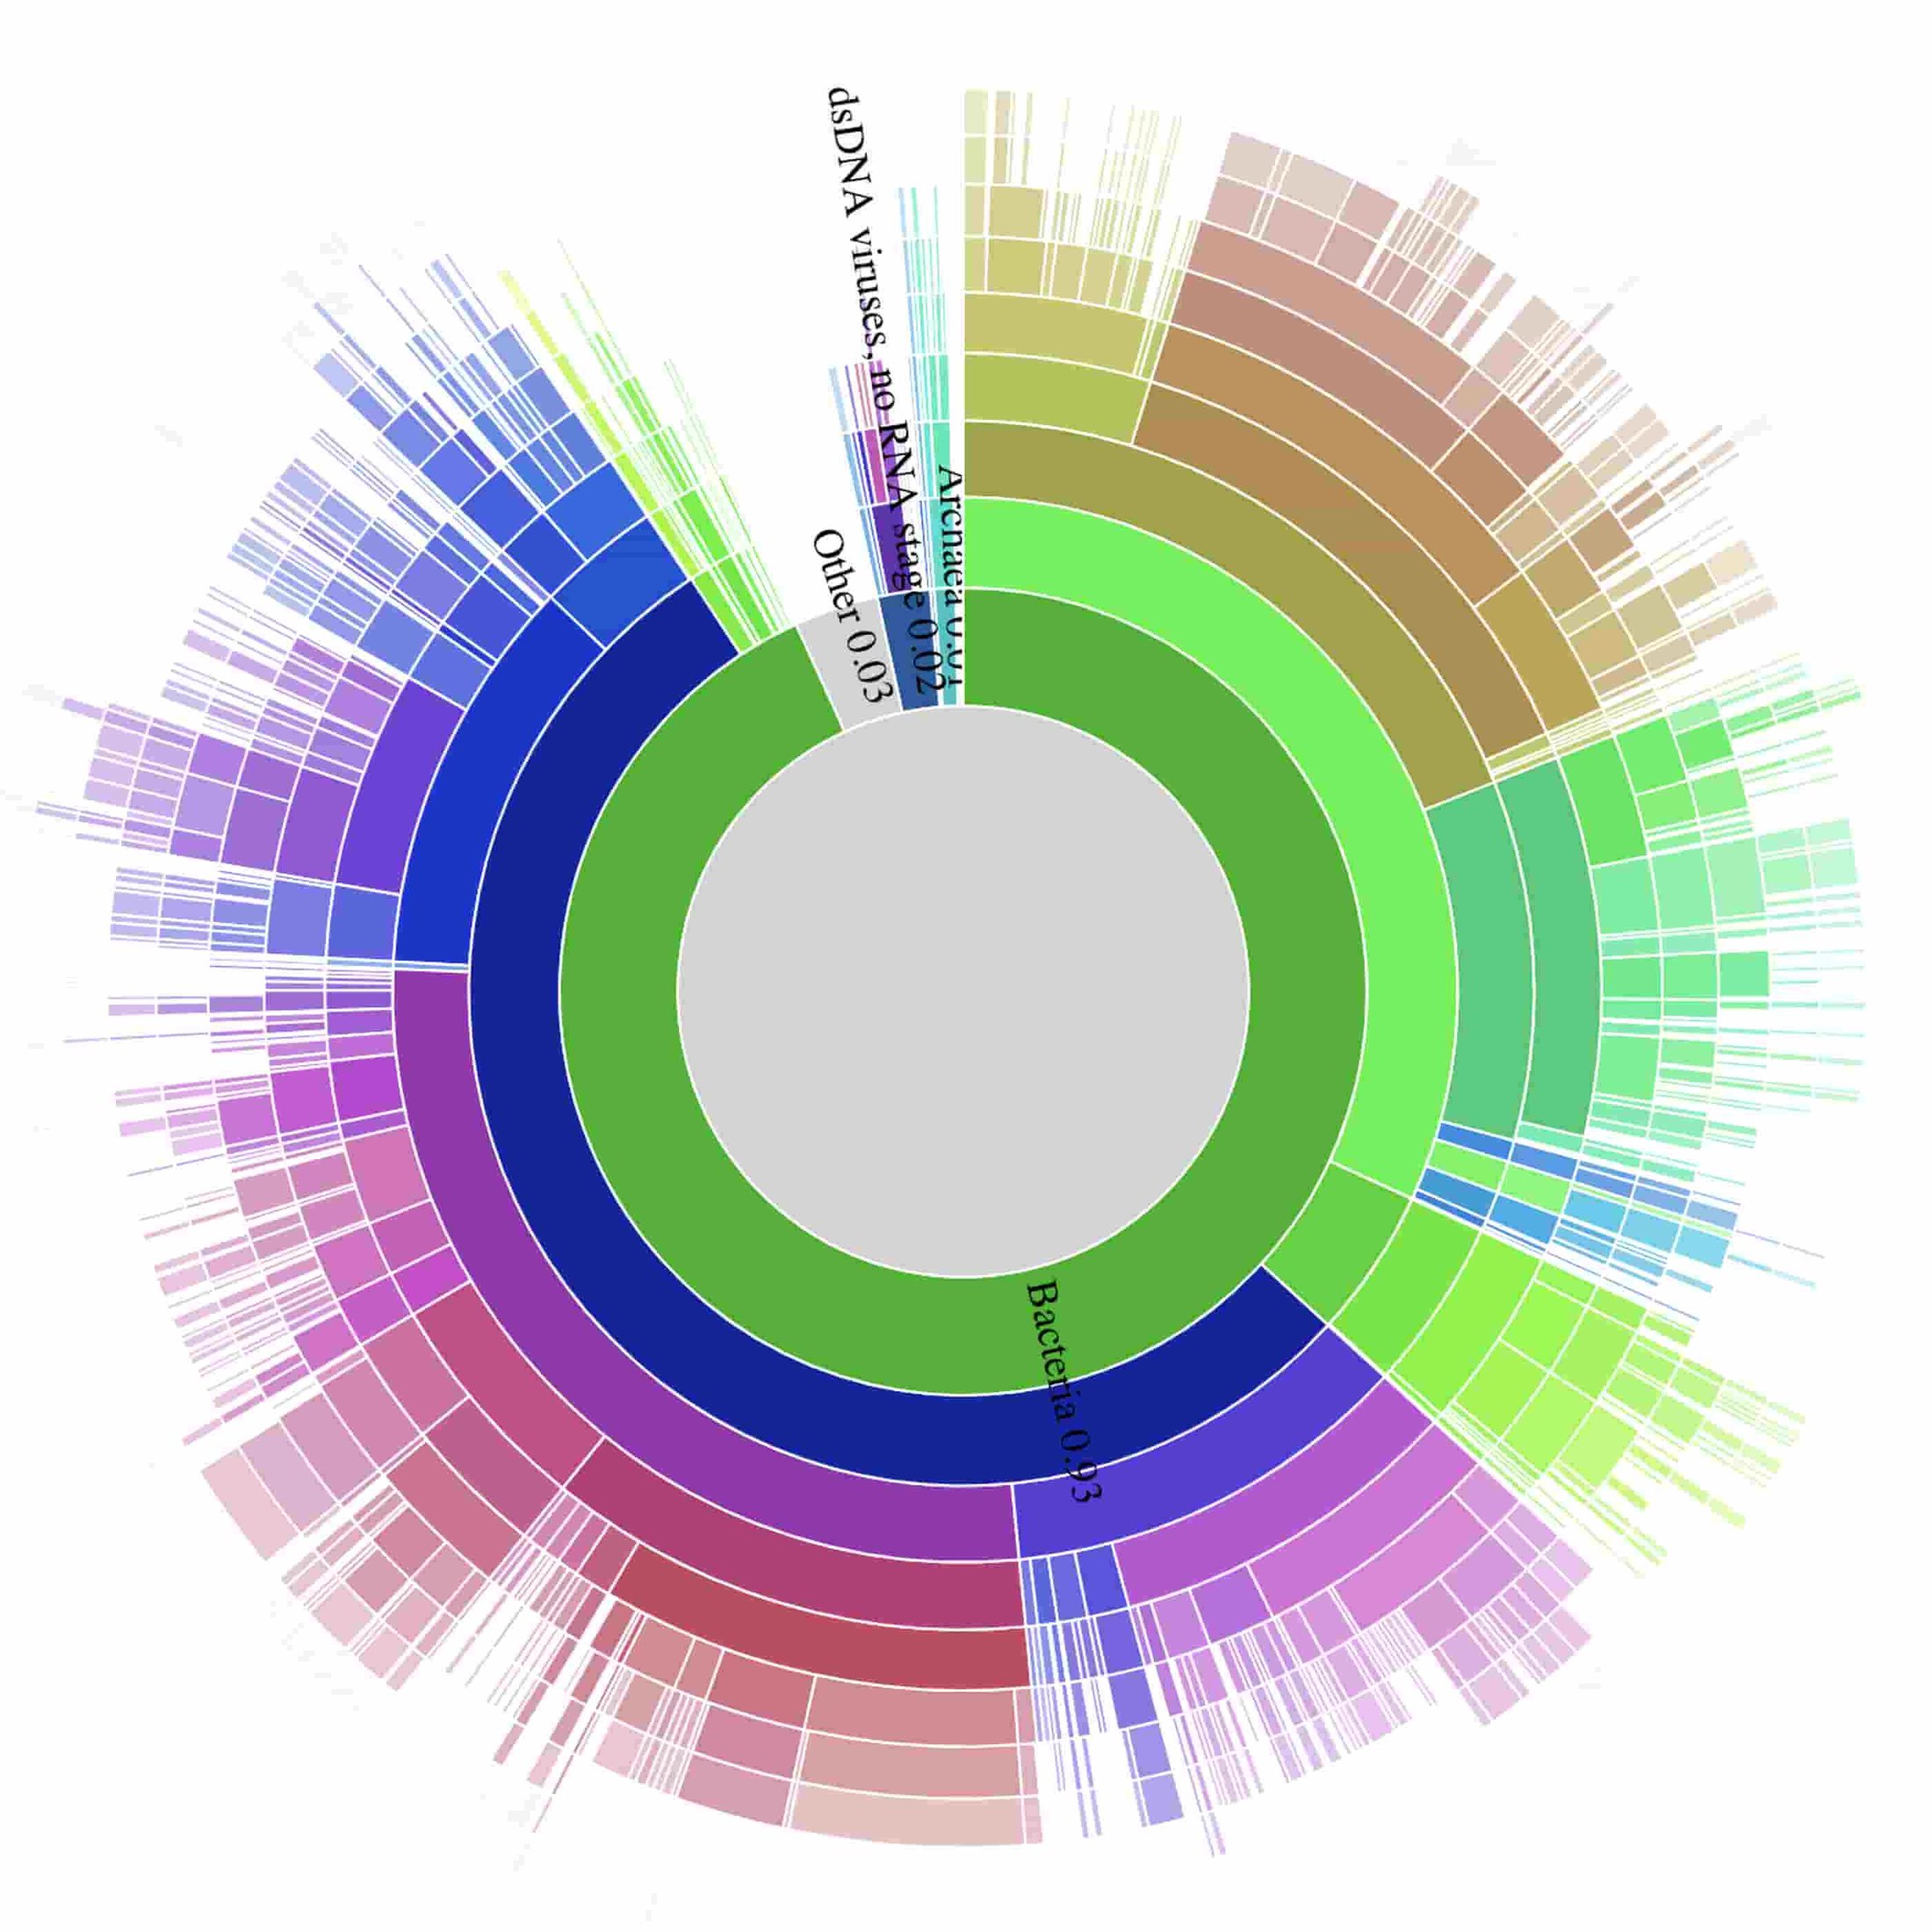
A patient with a recent history of a dog bite was admitted to the intensive care unit with severe sepsis, including multi-organ failure, severe acute kidney injury and haemolysis. After failing to grow on blood cultures for three days, a successful diagnosis was obtained after nineteen hours of nanopore sequencing.
While the majority of nanopore reads mapped to the human genome, the team also observed the bacterial genomes Capnocytophaga canimorsus, a pathogenic species of gingival flora of canine and feline species that is sometimes transmitted through bites and licks.
Bacterial cultures were obtained only after four days of growth, allowing for positive identification of C. canimorsus pathogen six days after the patient was admitted. The patient survived and is well. You can read a full clinical description of this case in Rapid Diagnosis of Capnocytophaga canimorsus Septic Shock in an Immunocompetent Individual Using Real-Time Nanopore Sequencing.
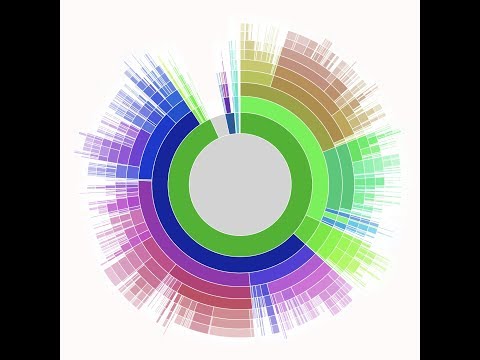
The team also prepared an interactive data visualization of the breakdown of detected species. Here’s a static preview of the data visualization:
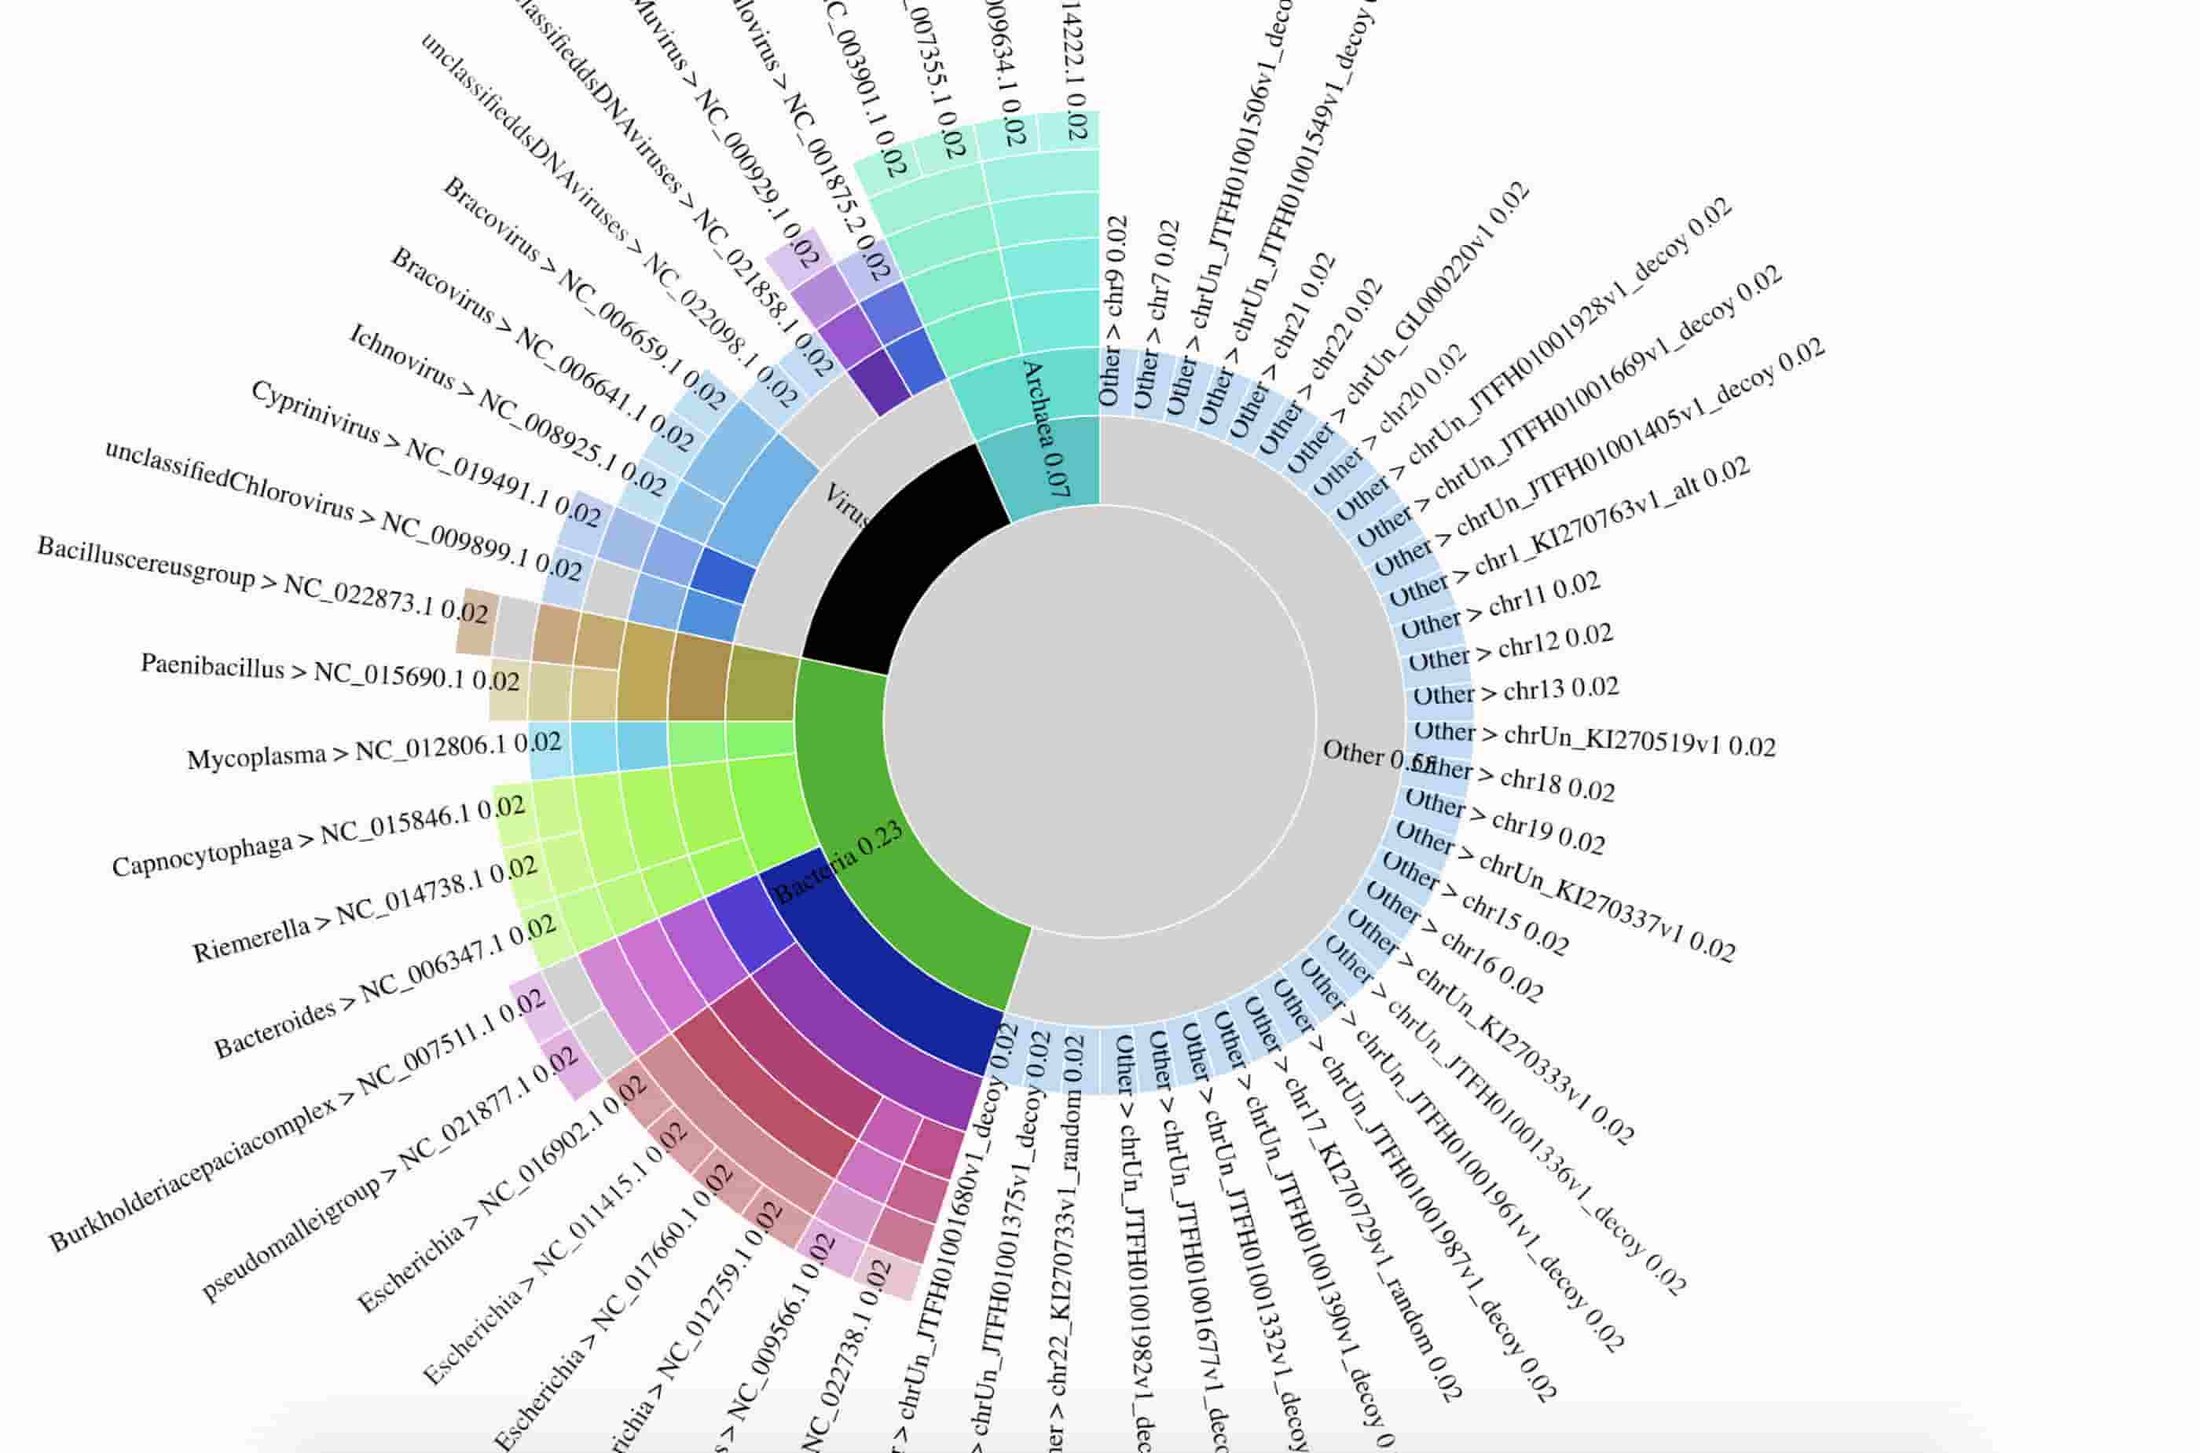
The data used to prepare the figure are in gs://nanostream-dataflow-demo-data/2_Klebsiella. To preserve the privacy of the patient, the research team replaced all reads mapping to the human genome with sequences from human reference genome NA12889.
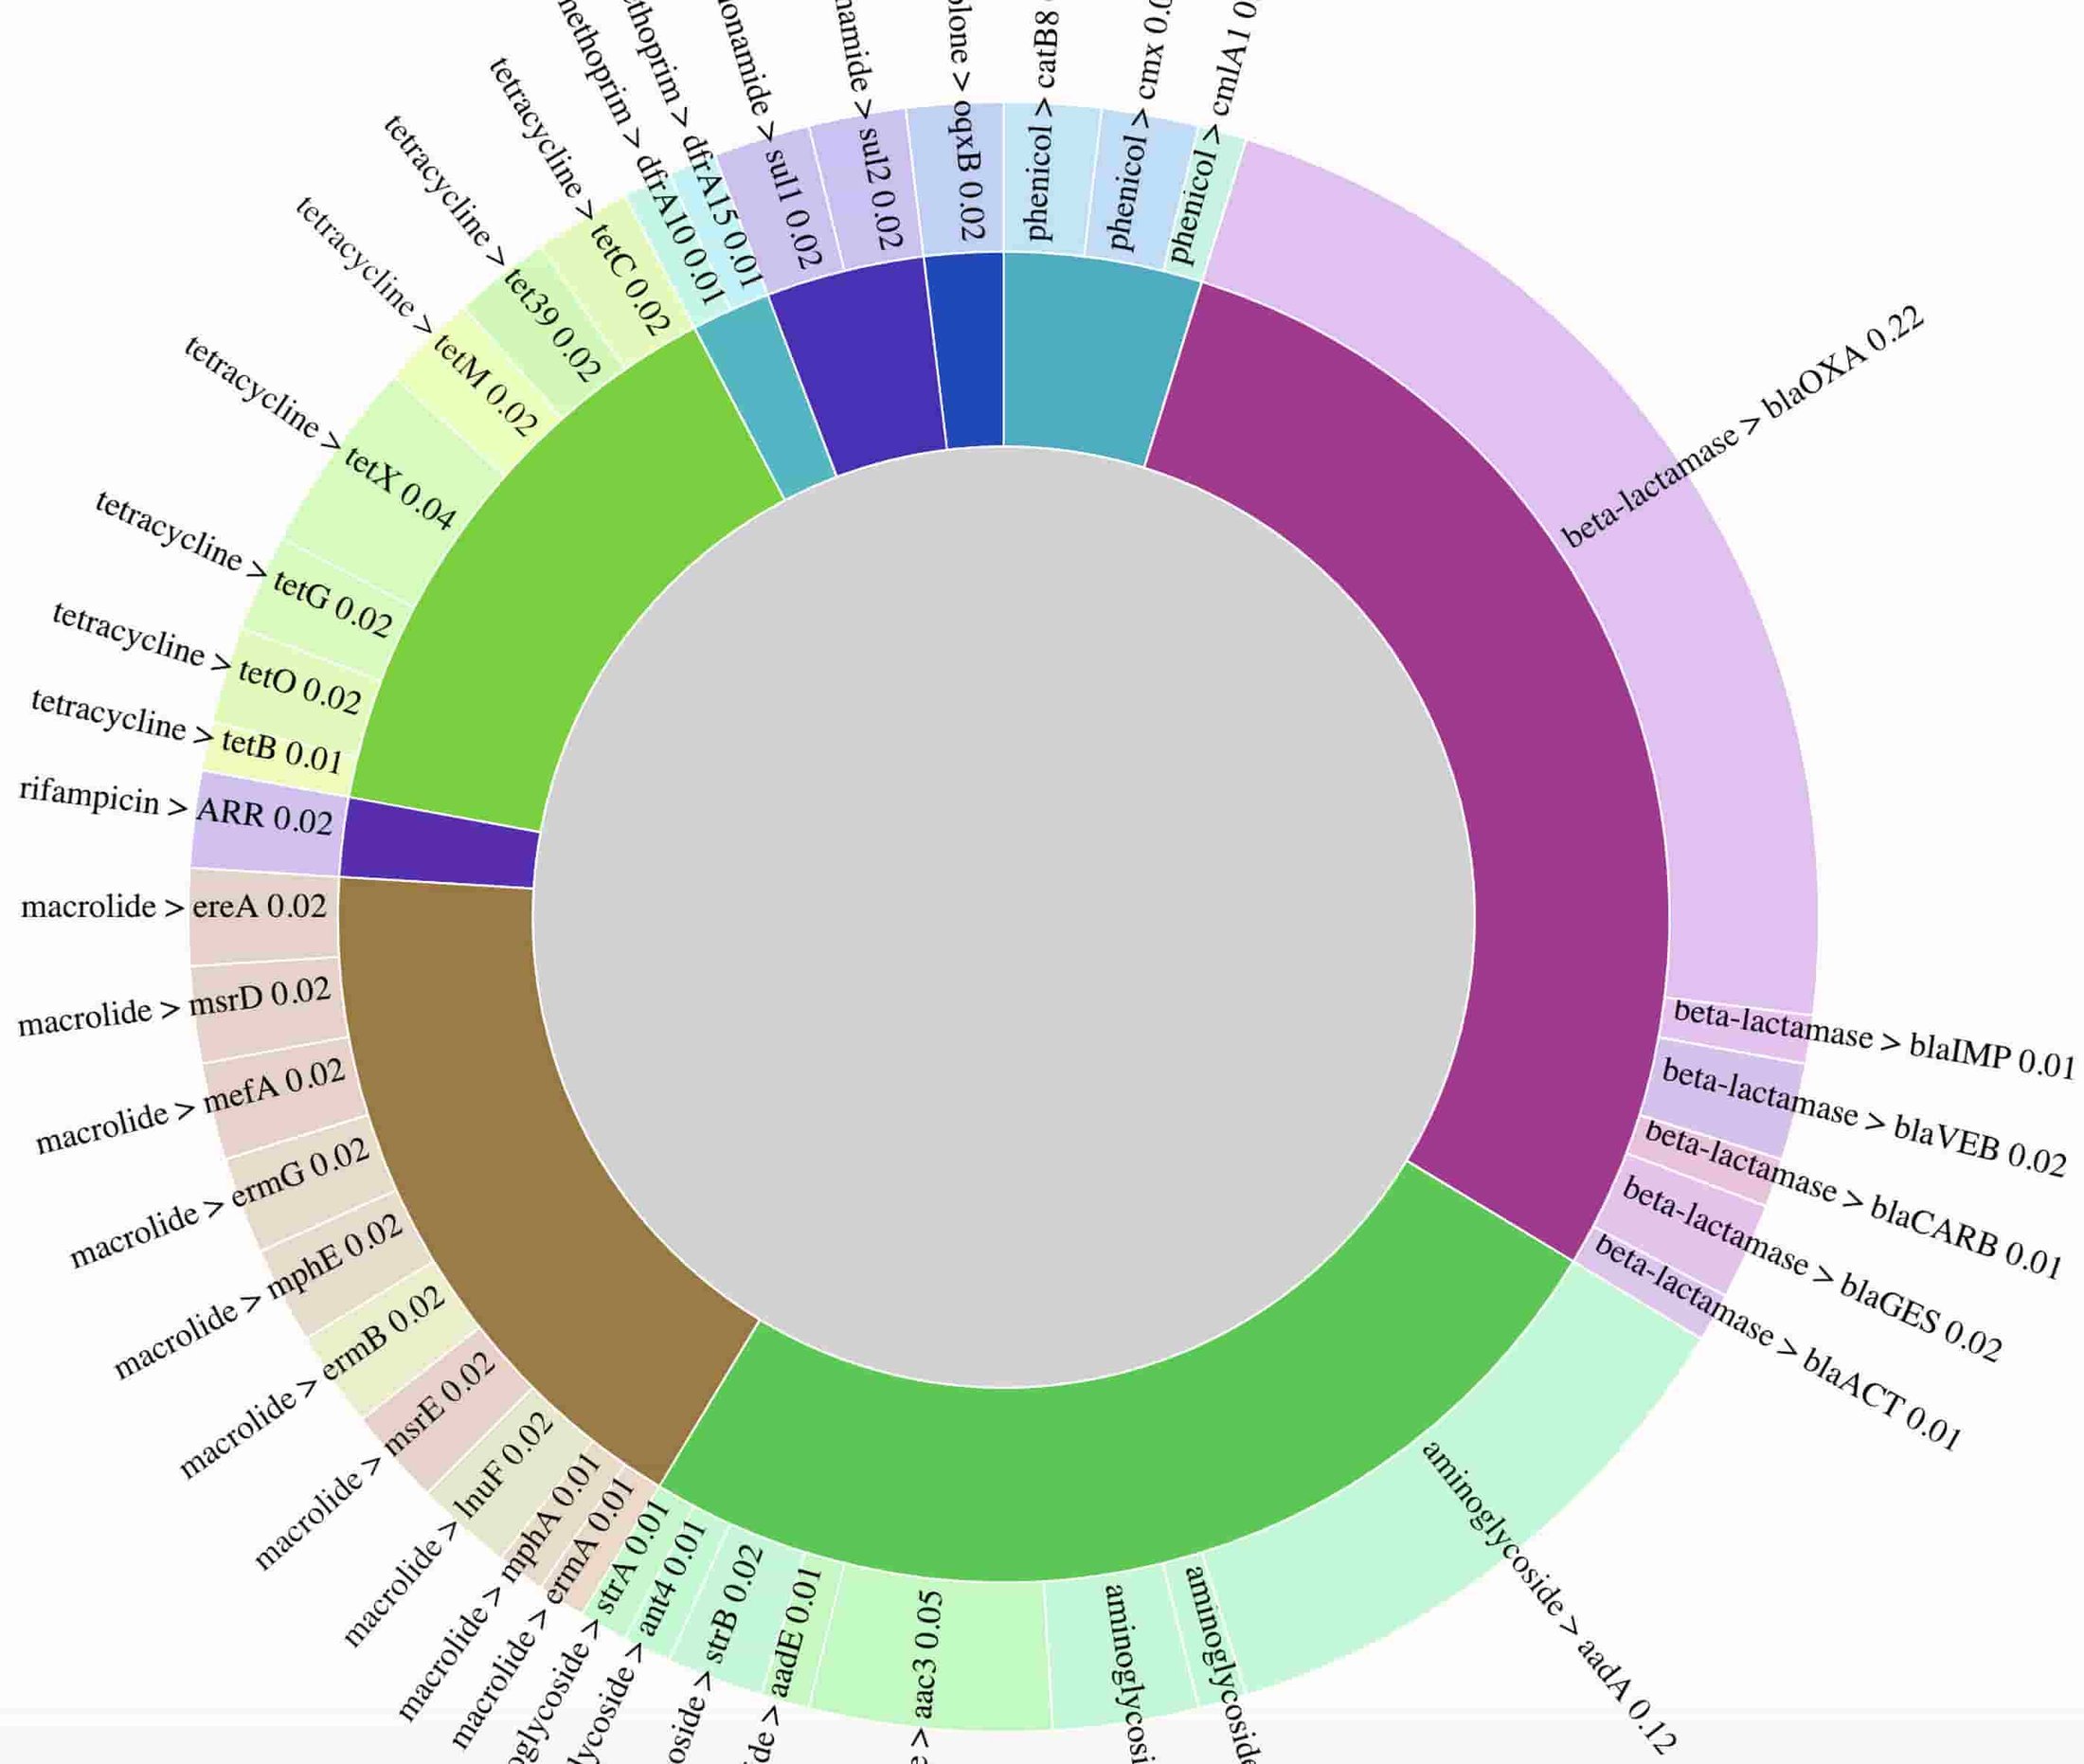
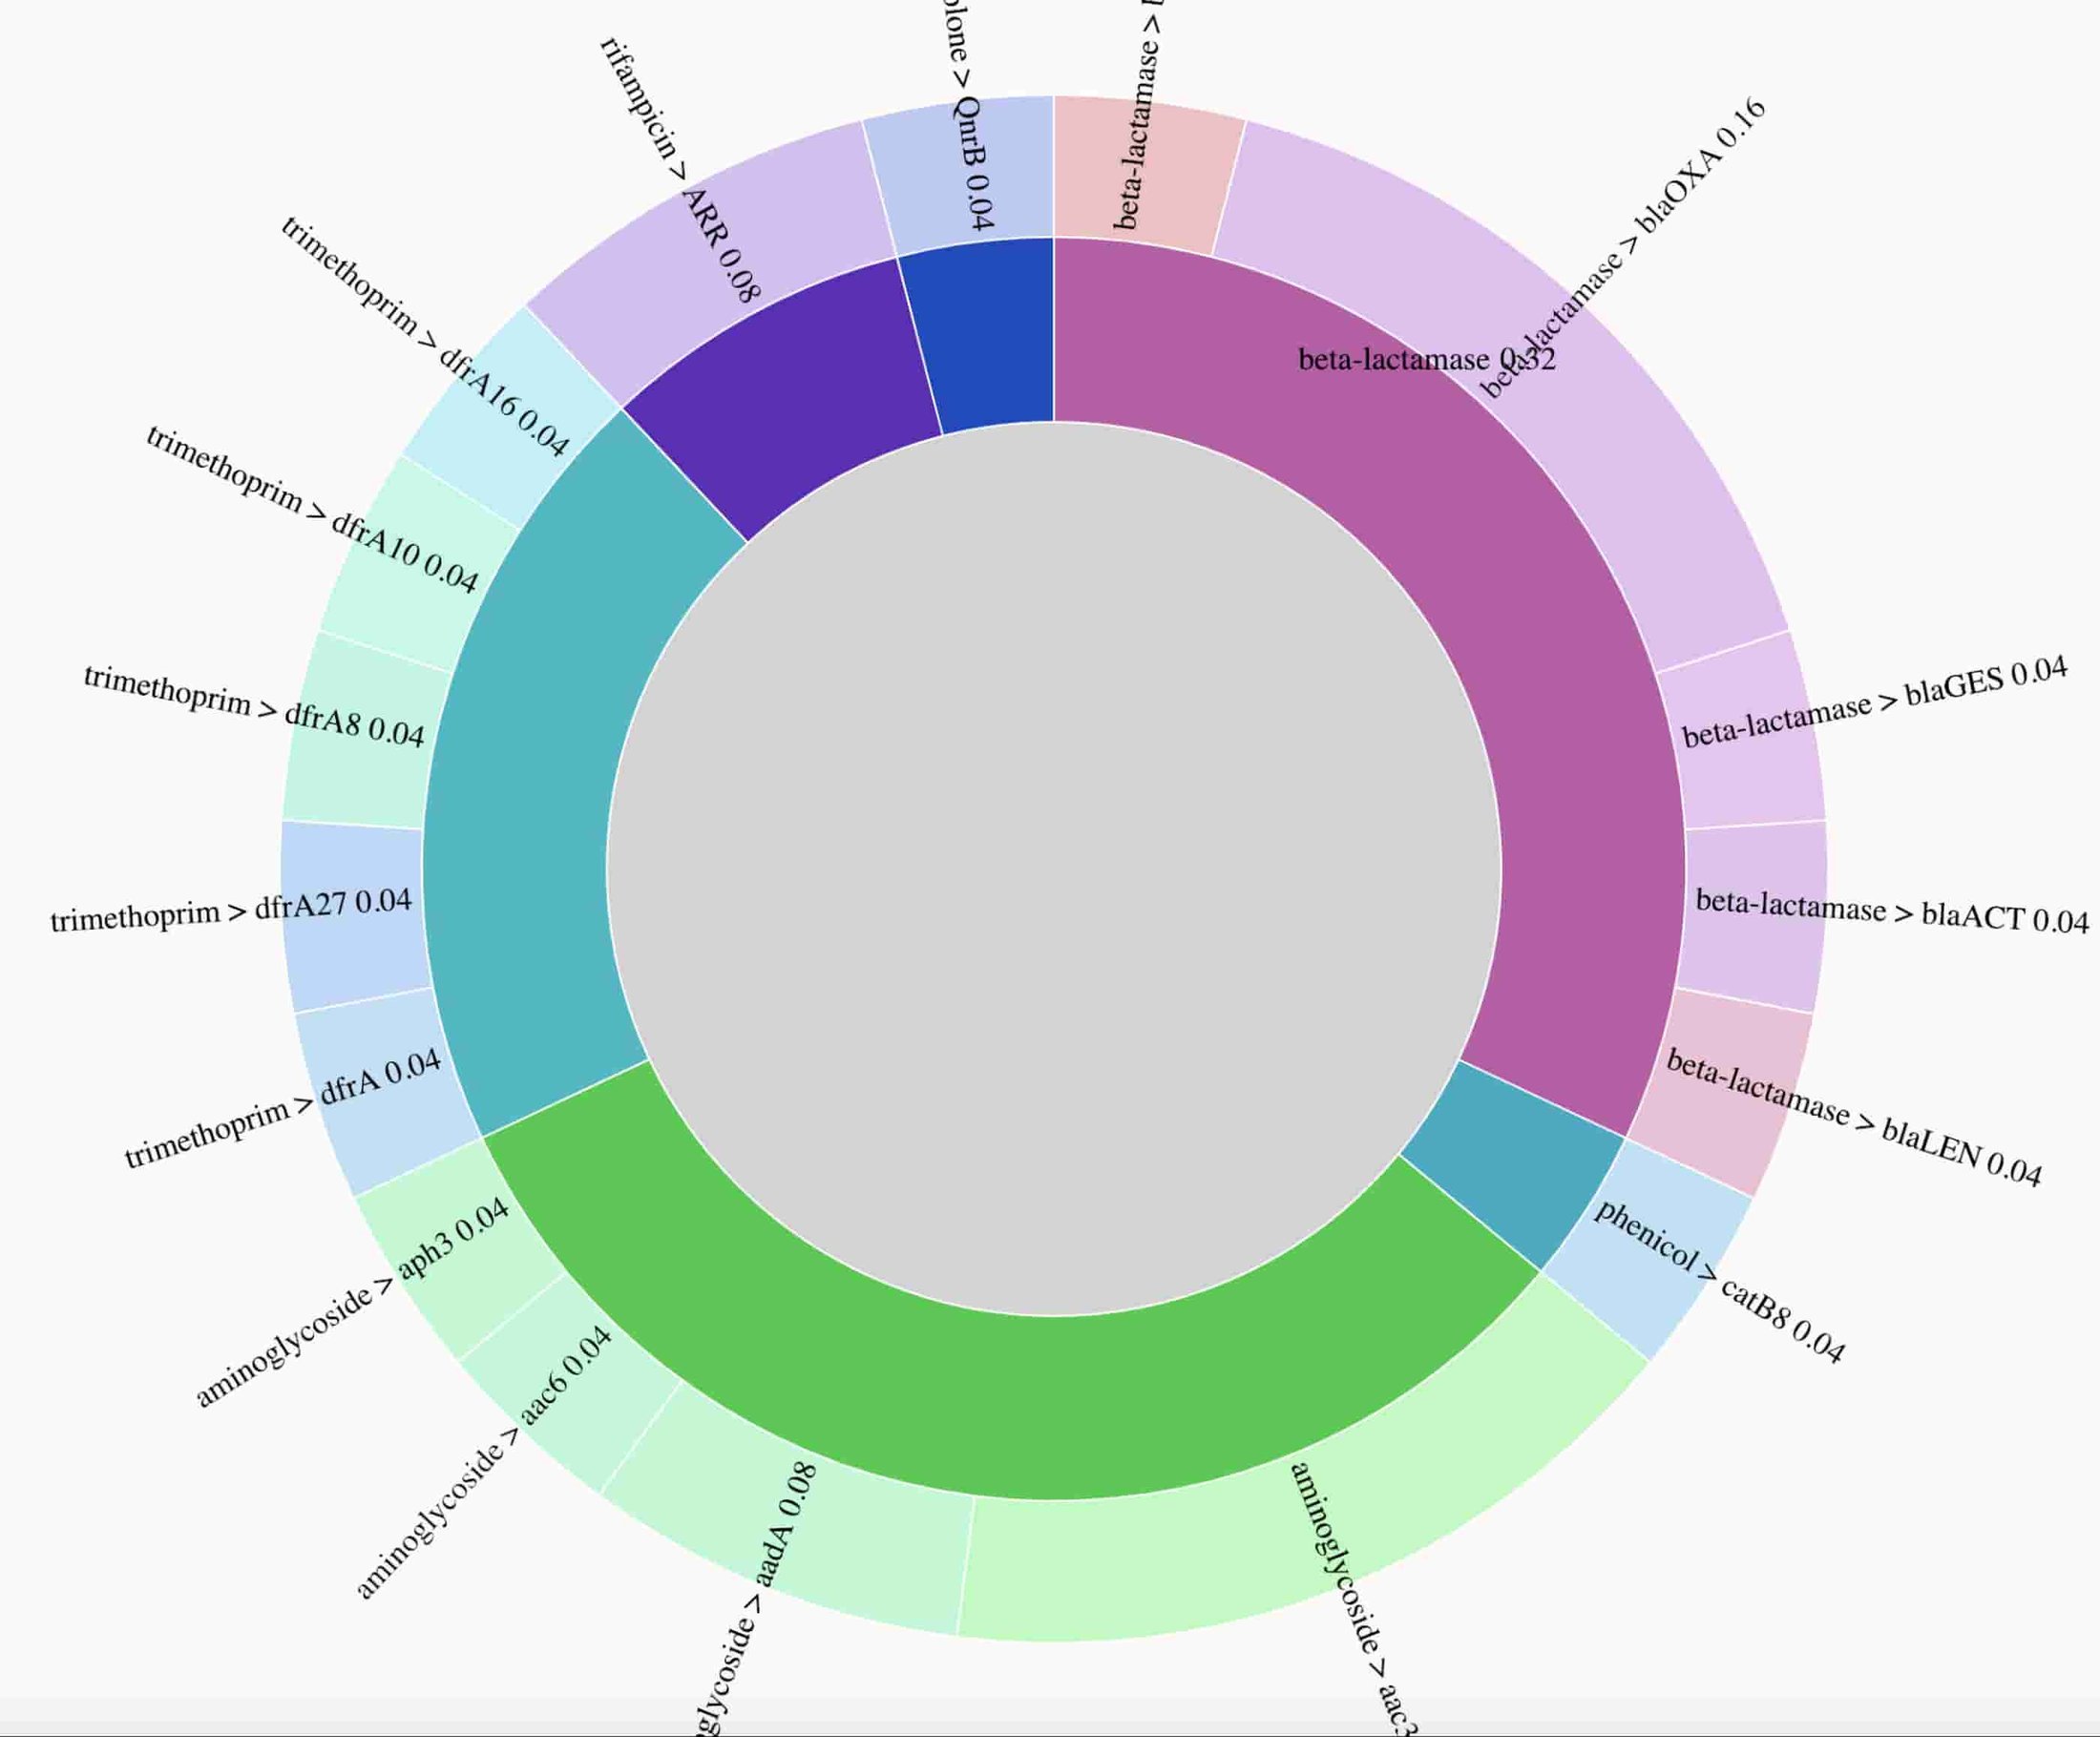
2. Superbug monitoring: profiling and tracking the evolution of antibiotic resistance genes in a Klebsiella strain
The team sequenced DNA extracted from a clinical isolate of an extensively drug resistant “superbug” ST258 Klebsiella pneumoniae strain to characterize its antibiotic resistance profile. A full description is available in Multifactorial chromosomal variants regulate polymyxin resistance in extensively drug-resistant Klebsiella pneumoniae. The team presents the results for sample 2_GR_12 here.
An interactive data visualization of the breakdown of detected resistance genes is the K. pneumoniae sample is available. Data used to prepare the figure are unavailable due to presence of reads mapping to the human genome.
Here’s a static preview of the resistance genes identified, with arcs proportional to the number of times a gene was observed. The visualization demonstrates the presence of genes conferring resistance to multiple drug classes, consistent with phenotypic drug resistance testing results, which found this isolate to be resistant to all drugs tested. In a clinical setting, rapid identification of extensive drug resistance such as this can help prioritize use of the latest generation of antibiotics, or potentially suggest antibiotic drug combinations.
3. Pathogen detection in sewage: a public health use case
The previous examples demonstrate the utility of sequencing patient DNA. In an unpublished collaboration with Dr. Guangming Jiang from the Australian Water Management Centre, the team sequenced DNA obtained from sewage to identify bacterial species present.
Environmental sensing and anomaly detection of air- and water-borne organisms is another promising use case for streaming DNA sequence analysis. This technique further generalizes to food safety and customs/border control applications.
Interactive data visualizations of taxonomical proportions and resistance genes in the sample are available, and data used to prepare the figures are in gs://nanostream-dataflow-demo-data/4_Sewage.
Here are static previews of the interactive data visualization that demonstrates the complexity of the sewage microbiome. Analysis of the acquired resistance genes present in this sample reveal a higher prevalence of beta-lactamase, aminoglycoside and macrolide resistance genes.
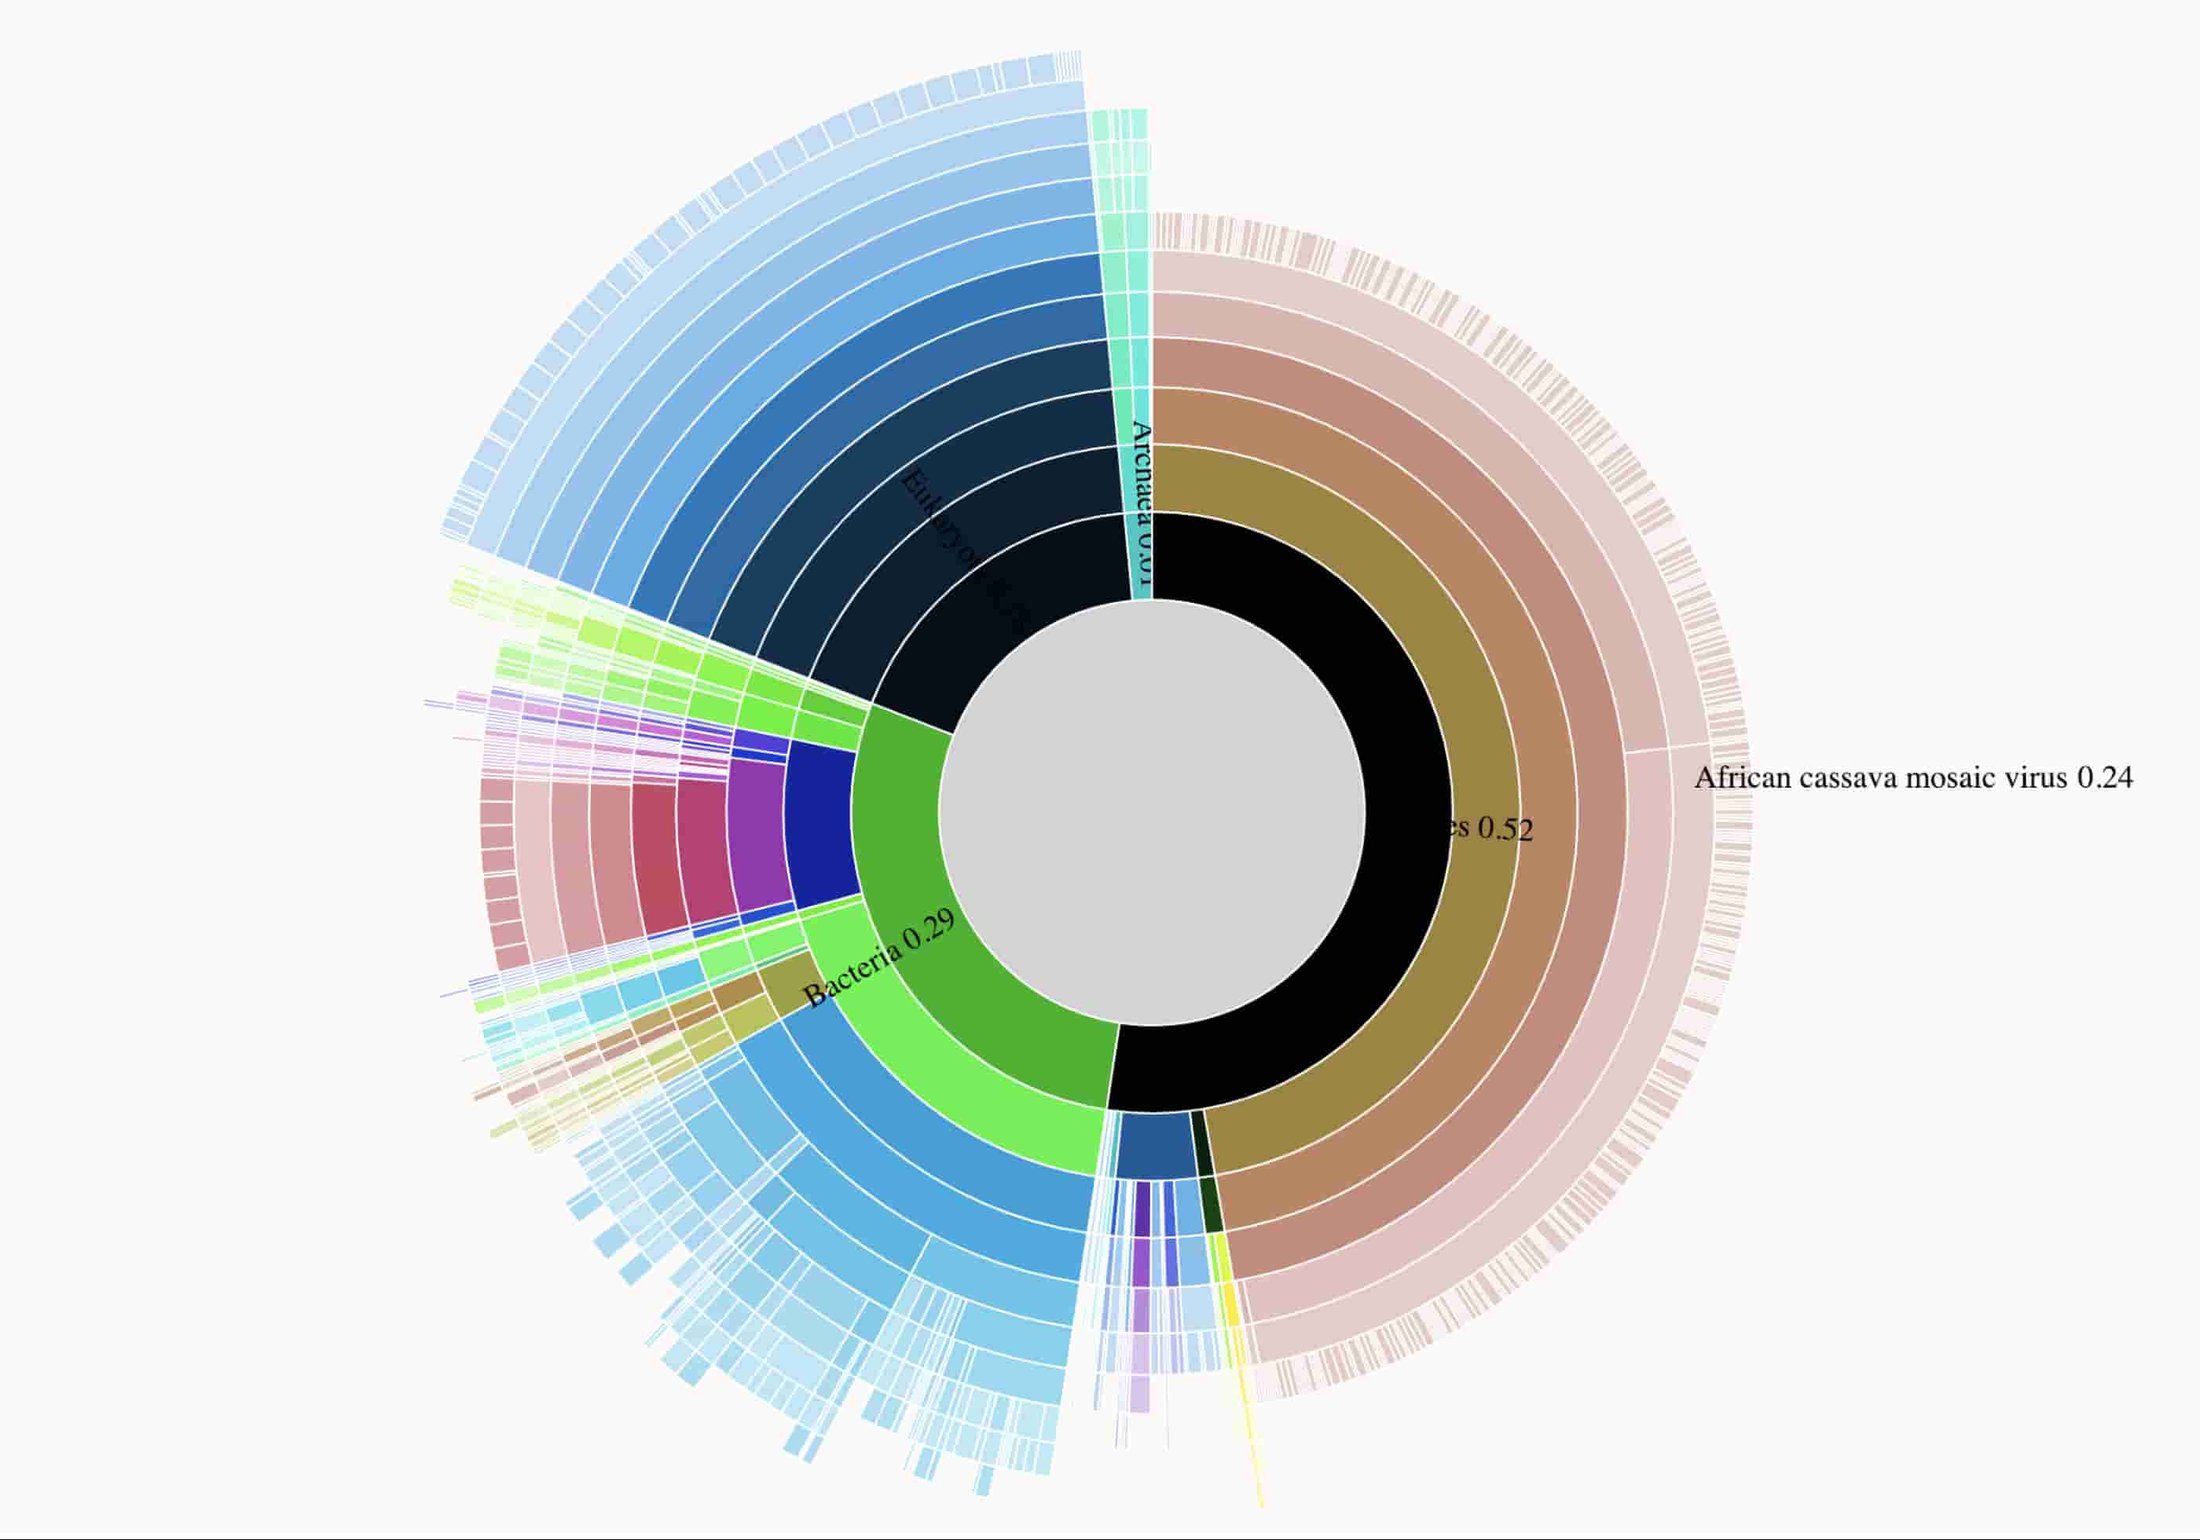
4. Agricultural Use Case: identification of viruses in cassava crops in Africa
Cassava is a major staple crop in Africa and is the third largest source of carbohydrates in the world. Cassava mosaic virus (CMV) causes cassava mosaic disease (CMD) which can cause crop yield losses of more than 80%.
Cassava is vegetatively propagated, so it is vulnerable to viral infections and CMD is spread primarily via movement of cuttings from disease-affected cassava.
Dr. Laura Boykin has been using nanopore sequencing plant material to identify viral plant infections in a variety of countries in sub-saharan Africa. The analysis performed here is based on data described in Real time portable genome sequencing for global food security. The visualization indicates that the plant sample processed is contaminated with CMV.
Here's an interactive data visualizations of taxonomical proportions in the sample are available, and data used to prepare the figure are in gs://nanostream-dataflow-demo-data/5_Cassava.
Here's a static previews of the interactive data visualization that clearly shows the sequenced sample is infected with CMV.
Conclusion
Nanopore DNA sequencers reduce the time it takes to generate DNA sequence data from weeks to minutes by providing a portable, miniaturized sequencer which can be taken to the sample—the patient, sewage plant, or crop field—as well as providing access to sequence data as soon as it is generated. Google Cloud provides highly scalable computing resources, plus frameworks for processing data in a continuous stream. The application the team built is responsive—simply synchronize the data with a Cloud Storage bucket to automatically initialize the pipeline, and it scales automatically to keep pace with data generation, while continuously updating the data analysis in a browser-based visualization.
Google Cloud strives to build tools essential to a variety of clinical, public health, agrarian, and security settings. You can learn more about genomics and data processing on Google Cloud.