Enabling SRE best practices: new contextual traces in Cloud Logging
Eyamba Ita
Product Manager, Google Cloud
Yoshi Yamaguchi
Developer Advocate, Cloud Developer Relations
Try Google Cloud
Start building on Google Cloud with $300 in free credits and 20+ always free products.
Free trialThe need for relevant and contextual telemetry data to support online services has grown in the last decade as businesses undergo digital transformation. These data are typically the difference between proactively remediating application performance issues or costly service downtime. Distributed tracing is a key capability for improving application performance and reliability, as noted in SRE best practices. Today, we’re making it easier for you to understand what is happening within your applications by making trace information available directly in Cloud Logging.
Tracing provides critical insight into the overall performance of applications running in a distributed architecture by stitching together relevant information about events from the propagated request’s point of view. These events are referred to as spans, and they are the building blocks for trace objects.
Faster insights and correlations with logs and traces
Distributed tracing offers the unique ability to reduce Mean Time To Repair (MTTR) by correlating log information with the sources latency in a distributed system. This capability is especially critical when users have workloads running in, or interacting with, distributed compute environments like Google Kubernetes Engine (GKE).
When your applications are instrumented to generate structured log outputs especially with Google Cloud Logging libraries and OpenTelemetry to generate traces, trace facets will automatically appear on log lines within Cloud Logging. This makes it easy for you to quickly understand causally related events.
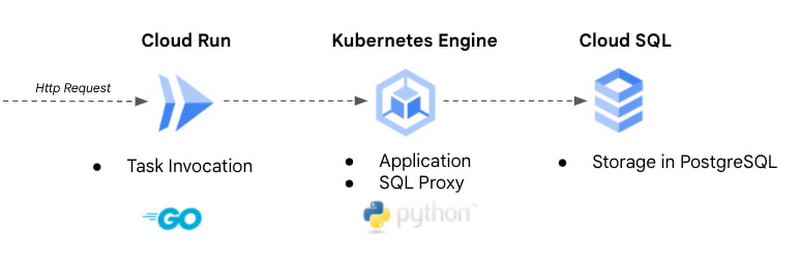
To illustrate this capability, consider the simplicity of troubleshooting the situation below. This is a Cloud Run instance making search invocations to a GKE cluster and then to a database layer managed by Cloud SQL. The application performing the invocation in Cloud Run is deployed using Go and the middle tier in GKE is deployed using Python (Flask).
In this example, a member of the support staff observes a notification in the activity log of their Google Cloud console, that their microservices-based application has slowed down considerably. One typical way of troubleshooting this is to dig through all the solutions logs for that timeframe to find the root cause. However, if the operations team has instrumented all workloads to generate traces, the application owners can use that information to narrow down which service is the source of the issue. After identifying the lagging service, they can follow up with the service owners to troubleshoot, drastically reducing MTTR.
The video capture below showcases the integration of trace information in the Logs Explorer of the Cloud Logging product:
How traces are generated in Google Cloud services
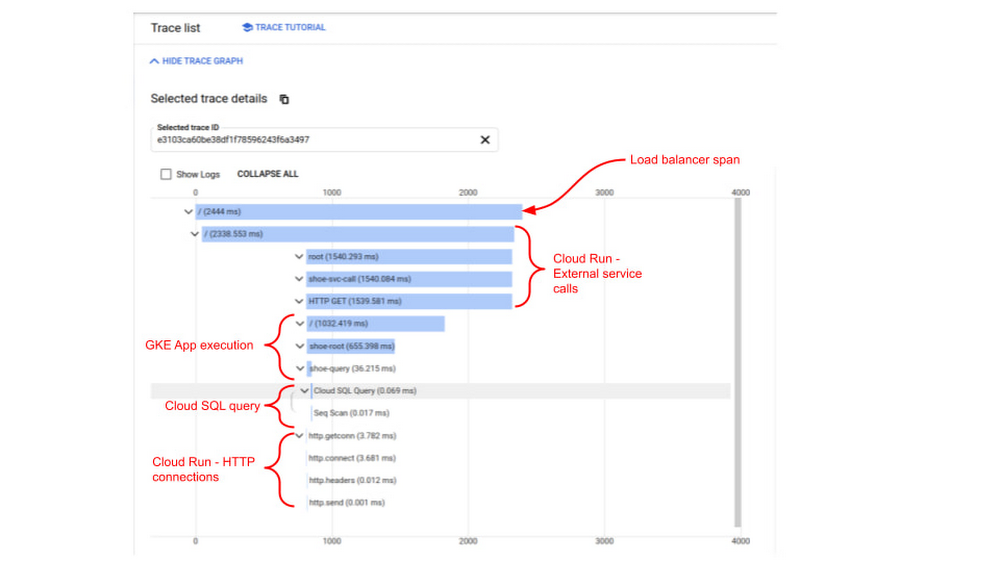
To create the trace in the sample above, the Cloud Trace backend stitched together all the spans that were generated as the request propagated through the different Google Cloud services (Cloud Run, GKE and Cloud SQL). Then it surfaced that data into the Logs Explorer in Cloud Logging. A summary of how spans were created in each service is below:
Cloud Run: the generated spans are an out-of-the-box (OOTB) feature and are representative of the ingress and egress out of the preceding load balancers and Cloud Run compute instances.
GKE pods: the Python Flask application generates spans as a result of the developer implementing the OpenTelemetry Flask Instrumentor into their application.
Cloud SQL: spans are generated automatically for its query execution time when the SQL statements are augmented with Sqlcommenter.
A sample of the resulting trace hierarchy embedded in the log line is shown below.
Get started today
To view traces in Cloud Logging, you need to first instrument your applications running on Google Cloud to generate structured log outputs and traces. GKE will automatically capture logs written to stdout and stderr or you can use our Google Cloud Logging libraries to use the Cloud Logging API. To capture traces, we recommend instrumenting your applications with OpenTelemetry. Check out this codelab to experience instrumenting an application with OpenTelemetry and sending the traces to Cloud Trace.
If you have questions or want to provide feedback, please visit our Google Cloud Community page and leave a comment.