Monitoring made simple for Google Cloud VMware Engine and Google Cloud operations suite
Nargis Sakhibova
Product Manager on Google Cloud VMware Engine
Konrad Schieban
Strategic Cloud Engineer, Google Cloud Professional Services
Try Google Cloud
Start building on Google Cloud with $300 in free credits and 20+ always free products.
Free trialMoving workloads to Cloud has many benefits to organizations: automated upgrades and patches, added security, a cost-saving subscription-based model, on-demand capacity and more. If your organization has moved to the Cloud or is seriously considering it, you are probably wondering what to use for monitoring your infrastructure, application, network, workloads and more. Google Cloud VMware Engine customers now have an opportunity to monitor their VMware infrastructure using Google Cloud Operations Agent in Preview. Better still, for many customers, Cloud Operations Suite is free with their Google Cloud VMware Engine subscription, so long as their usage is under the free tier usage thresholds.
Google Cloud VMware Engine monitoring brings infrastructure data in a single portal
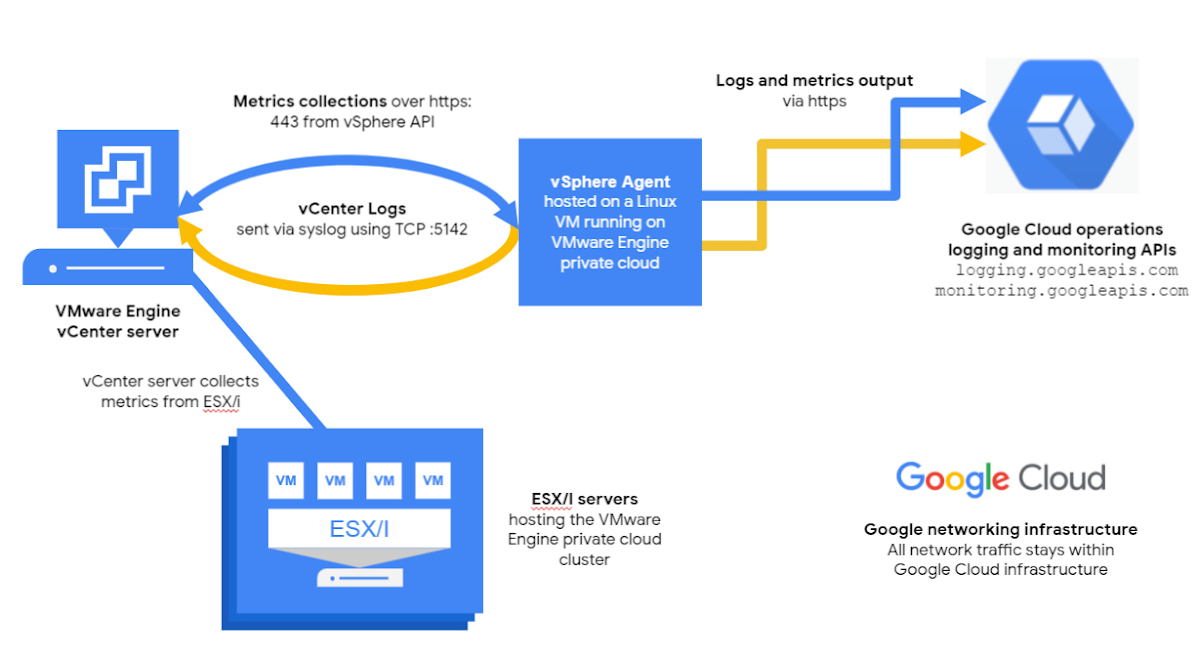
To make monitoring simpler, more secure, and more cost-effective, we’ve expanded the Google Cloud operations suite to include Google Cloud VMware Engine. Our newest Preview Cloud Operations agent for Google Cloud VMware Engine does not require an integration with a third-party solution while allowing you to collect vCenter and vSAN metrics and vCenter syslog. You can also use the same agent to bring infrastructure metrics and logs from your on-premise deployment to Cloud Operations.
The new agent lets you monitor infrastructure in one centralized tool with all the features of Google Cloud operations, like pre-built and customizable dashboards and integration with your existing alerting system so you can build alerts based on your own thresholds and logic.
Here is how it works:
Google Cloud VMWare Engine logs and metrics collection architecture
You have the ability to configure almost anything you need. For example, you can configure an alert via an SMS message on your phone to let you know as soon as a new VM is rolled up in your instance, so it’s truly in your hands immediately. For more complex needs, you can apply algorithms or build models to get deeper insights.
Transitioning to Google Cloud VMware Engine monitoring is simple
Google Cloud VMware Engine monitoring is easy to implement and use because you don’t need to develop anything, create tools, or worry about integrating metrics with dashboarding or alerting solution. Just as you normally would, when you roll out a VMware Engine private cloud, you can take the following steps to collect both syslog, vCenter and vSAN metrics.
Create a Linux OS VM instance on your private cloud, this VM will host your agent
Run a single line of code to install an agent
Configure the agent
Configure log forwarding
Create a service account with logging and monitoring privileges through Infrastructure as Code or Cloud Console.
Optional: you can also install free out-of-the-box Google Cloud VMware Engine dashboards from Git repository.
Detailed instructions are available here.
Simplicity beyond setup
Once you set up monitoring, you’ll notice that it never asks you what metrics you want to collect. You can, however, select which metrics not to collect (by default vCenter and vSAN metrics are collected). The tool identifies the servers, the metadata, and information such as the names of VM instances. It collects the metrics and logs at regular intervals. The metrics start flowing as soon as you sign into your Google Cloud operations account.
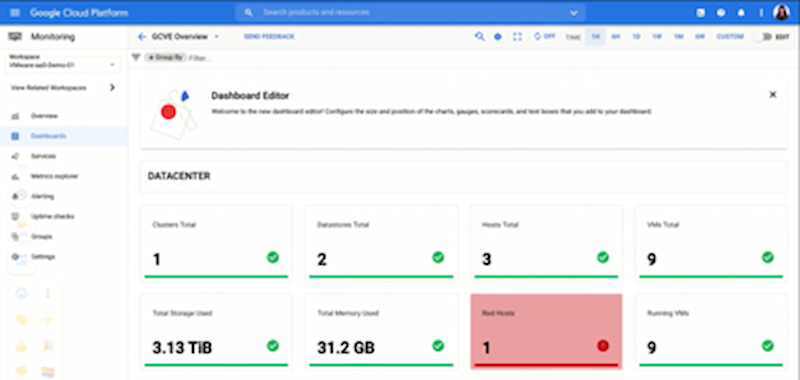
Once the data starts flowing, you can also use three premade Google Cloud VMware Engine dashboards (Overview, Contentions, and VM Performance) to speed up your monitoring efforts.
The Google Cloud VMware Engine Overview dashboard gives you a 30-mile view of your deployment, including high-level counts of your data centers, private clouds, ESXi nodes, red VM instances, total VM instances and more. You can easily swap, add, or remove metrics in the dashboard. As you scroll down, the dashboard gives you a more granular view of your deployment, first zooming into your ESXi hosts and then VM instances.
Google Cloud VMware Engine Contentions dashboard allows you to see which resources—CPU, memory, or storage—are at risk of being exhausted along with which assets—ESXi hosts, VM instances—are consuming most of your resources.
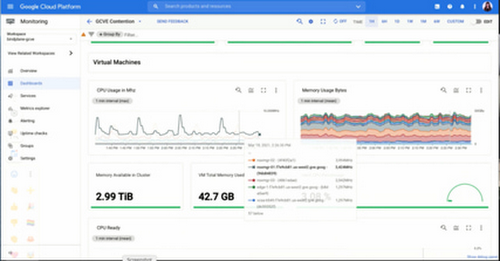
Google Cloud VMware Engine Virtual Machines Performance dashboard presents you with a plethora of information about your virtual machines. We recommend you use this dashboard while zooming into a specific group or individual virtual machine by using a filtering capability of the dashboards.
Time savings with integrated alerting
While an important differentiator for Google Cloud VMware Engine is that Google manages VMware infrastructure and Google Site Reliability Engineers monitor critical vCenter events, you might be interested in collecting logs and metrics from Google Cloud VMware Engine private clouds for a range of observability use cases. Let’s consider a typical use case for an infrastructure admin at your company.
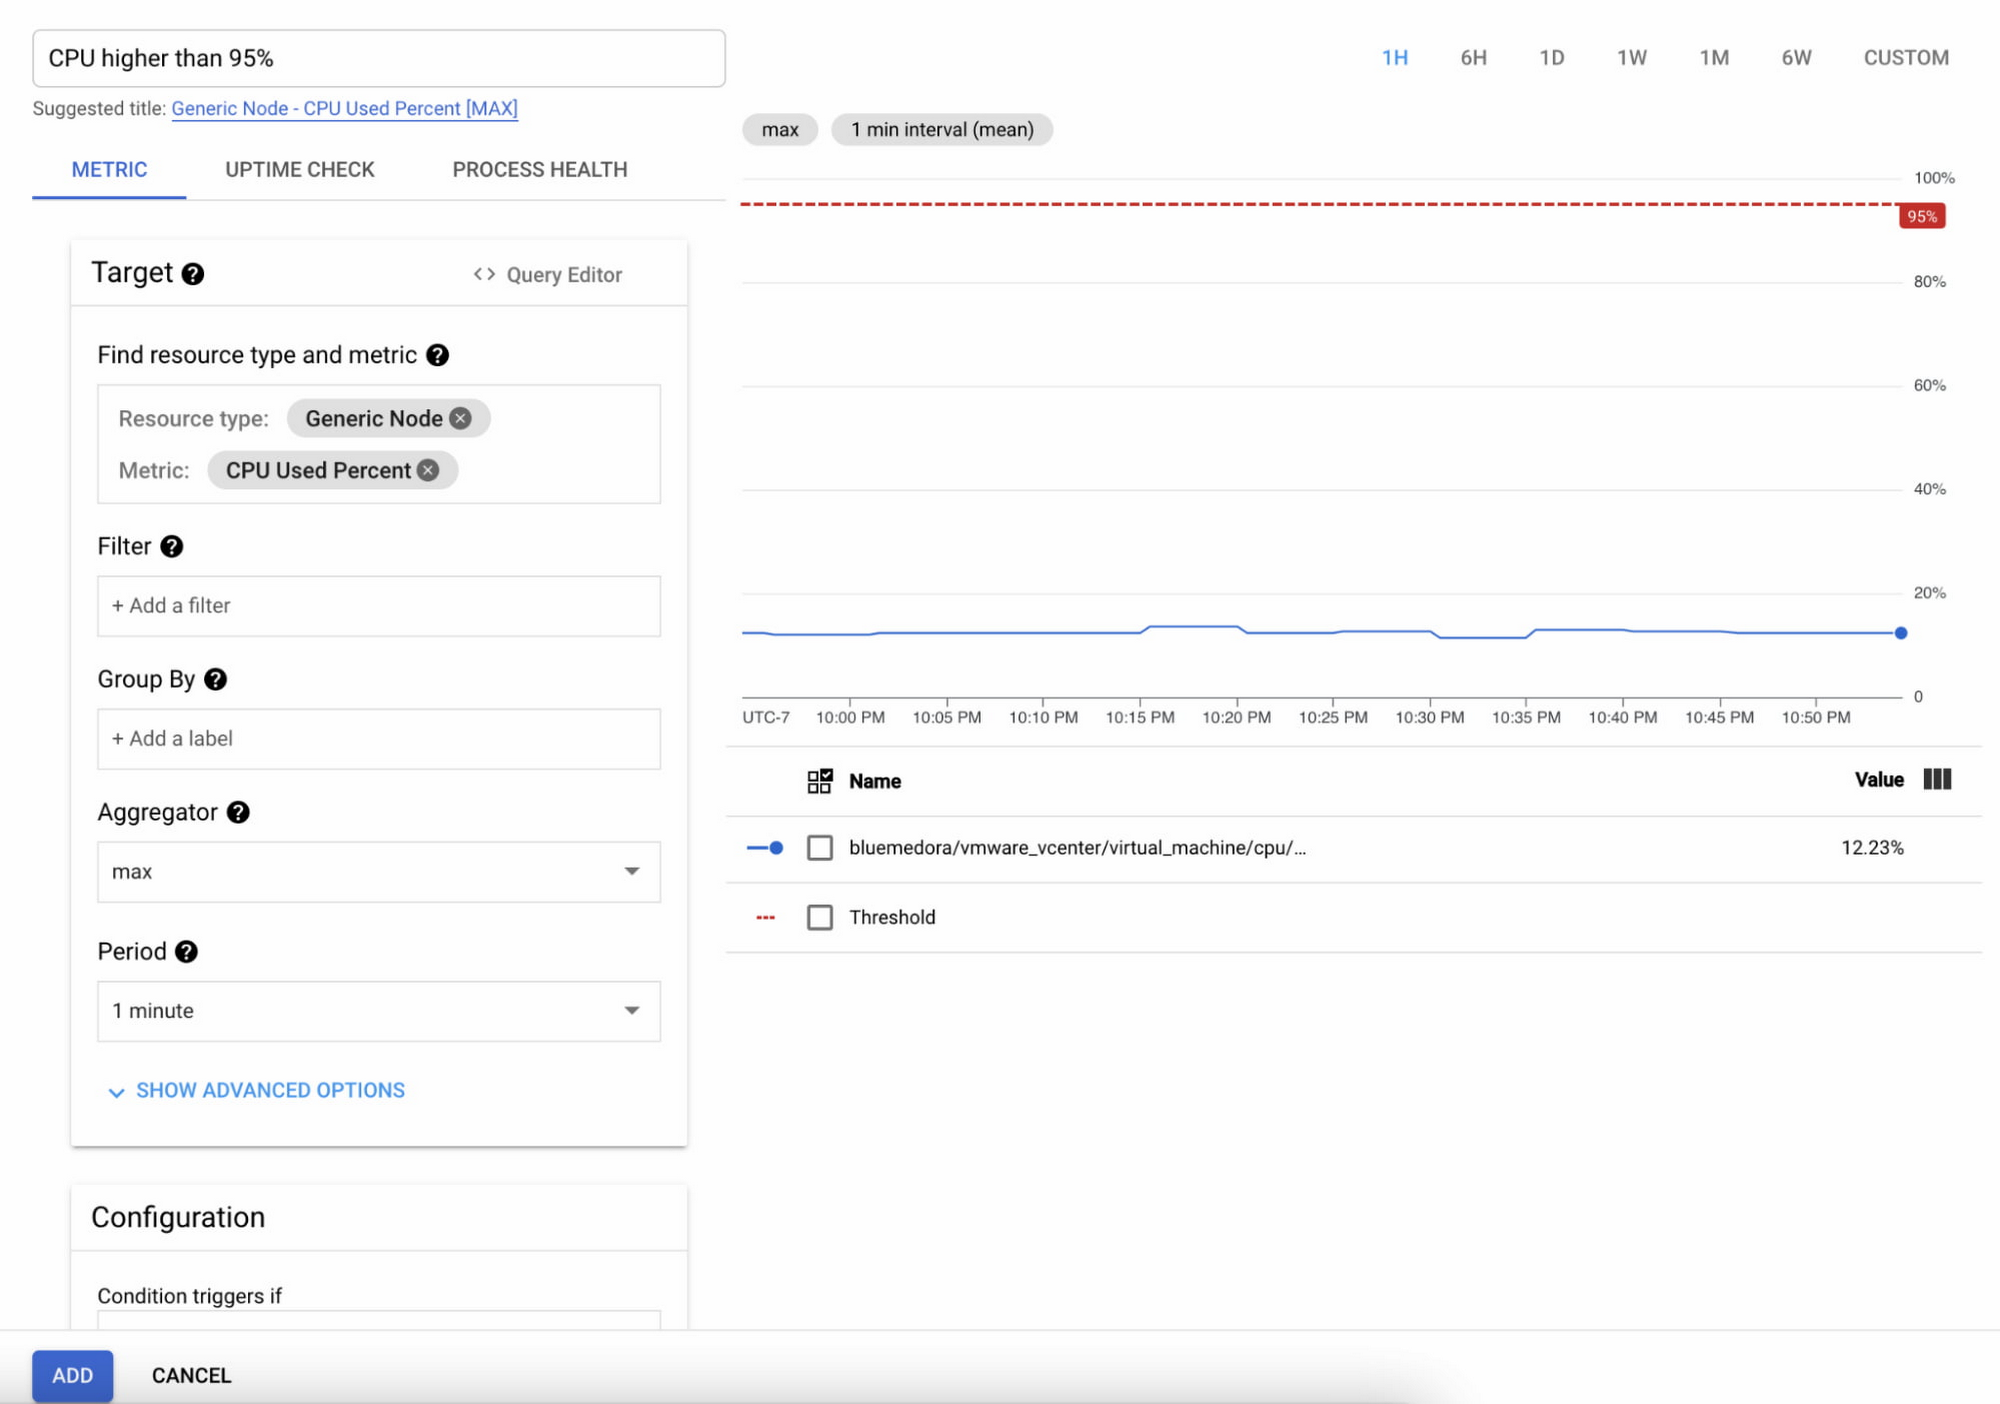
After a successful migration of their application to Google Cloud VMware Engine, the admin can use any of the metrics collected by the metrics agent, to create a policy through cloud alerting and alert themselves via a channel of their choice (SMS, email, Slack notification, and more). The admin is alerted if CPU, memory, or storage reaches a threshold that they deem to be dangerous are violated. That way Cloud operations does the monitoring, and the admin only needs to check on the infrastructure when an alert is triggered.
Power in unified logging and monitoring
Ultimately, the story would not be complete without your logging data. Current setup allows you to send your vCenter syslog to Cloud operations, too. Just like with metrics data, syslog data becomes available in Cloud Logging almost instantly. Let’s consider a typical use case for a Security Auditor.
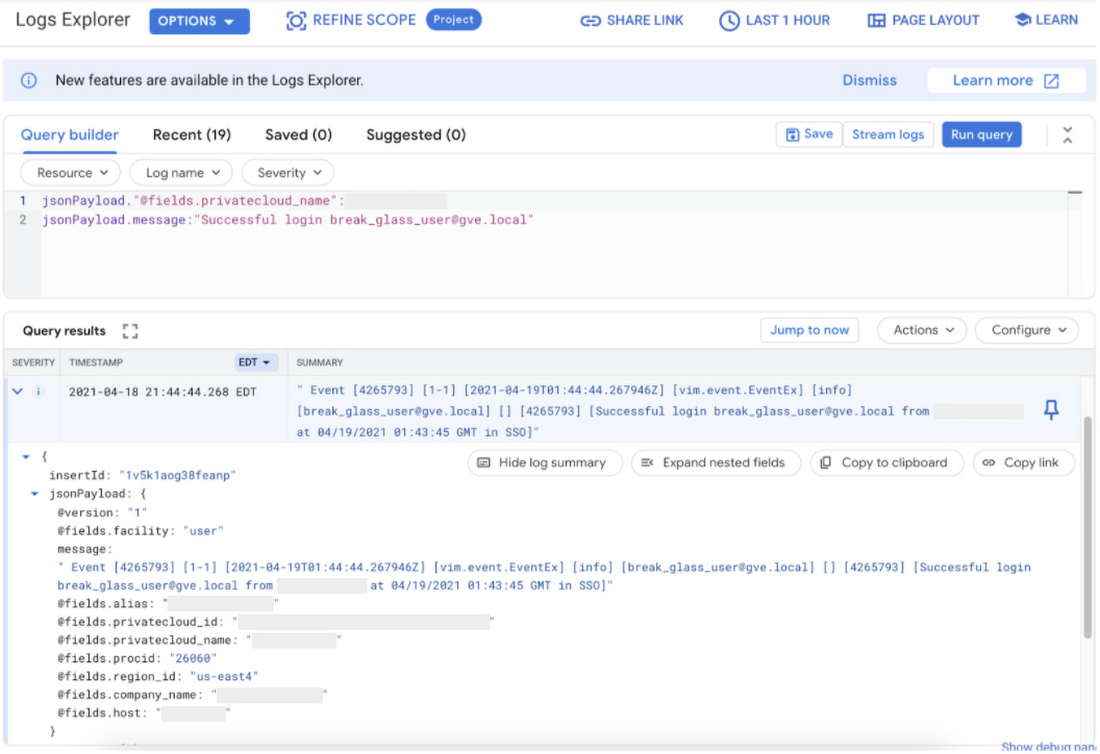
After successfully integrating vCenter with your identity domain, you may consider auditing sign-in events by a local user in vCenter. In addition, you may want to receive an alert if such a local user is used. Using the following Log Filter you are able to determine when the (fictitious) local user “break_glass_user@gve.local” was used and from which IP address the event originated:
jsonPayload."@fields.privatecloud_name":your-private-cloud-name
jsonPayload.message:"Successful login break_glass_user@gve.local"
An example event is shown in the following screenshot of Cloud Logging. Note that the IP address of the source server of the login event is shown in the message field but grayed out in the screenshot.
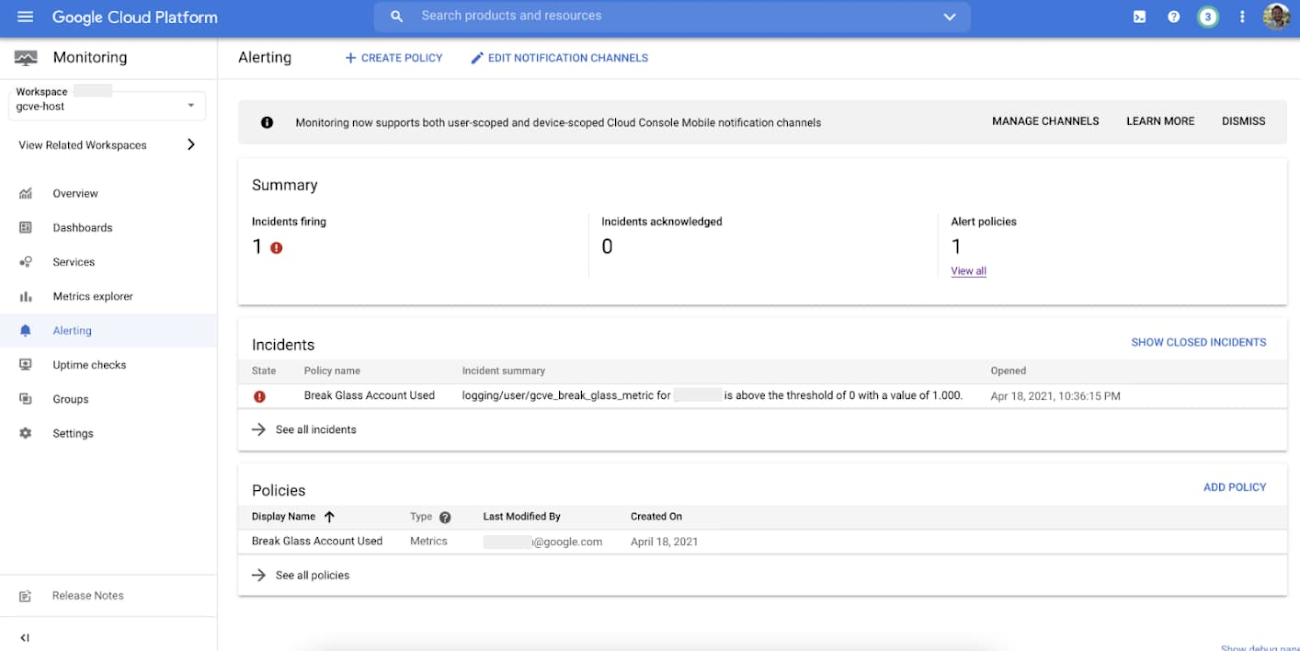
Alerts to operators and security auditors can be configured in Cloud operations based on Log Filters. As a next step, you can create a logs-based metric, which measures the count of local user sign-ins. Create an alert policy in Cloud Monitoring based on the metric you just created and configure an appropriate notification channel for alerts (email, Slack Channel, PubSub, etc.). Incidents will be visible in Cloud Monitoring for your review and acknowledgement:
We’re just getting started
While Google Cloud VMware Engine monitoring makes many advanced tools available to you right now, we’ve just started to build out its functionality. We have an aggressive roadmap to make integration completely setup free, adding more metrics, providing visibility into workloads and workload VMs, and making the most important information available to you at your fingertips. To learn more, check out our monitoring documentation.