How to investigate high tail latency when using Cloud Spanner
Tomoaki Fujii
Technical Solutions Engineer
When you use Cloud Spanner, you may encounter some high tail latency cases. Some of the causes may be on the Cloud Spanner side, but there could be some other reasons as well. In this blog post, we will talk about how to distinguish the high latency causes and also talk about some tips to improve Cloud Spanner latency.
Check the relationship between the high latency and Cloud Spanner usage
If you can find the high latency in Cloud Spanner metrics which are available in Cloud Console or Cloud Monitoring, the latency cause is either at [3. Cloud Spanner API Front End] or [4. Cloud Spanner Database] in the diagram from the Cloud Spanner end-to-end latency guide. Further investigation at Cloud Spanner level is needed.
On the other hand, if you can't confirm the high latency in Cloud Spanner metrics, the high latency likely happened before reaching Cloud Spanner from the client.
If high latency was observed in your client metrics, I recommend you check if
accessing other services had high latency
the client machine had any resource shortage issue
the high latency happened to a specific client machine
Some example causes are:
sudden CPU utilization spike (this itself is not the cause, but indicates other processes in the machine may have caused the latency)
hitting Disk I/O performance limit
ephemeral port exhaustion and not being able to establish a TCP connection.
high latency due coming from DNS queries
You can also measure the latency at [2. Google Front End] in Cloud Spanner end-to-end latency guide -- time from when GFE sends a request to when GFE gets a first response from [4. Cloud Spanner database] via [3. Cloud Spanner API Front End]. If you observe high latency in this metric, a further investigation needs to be performed on the GCP side. This can be achieved by opening a support ticket if you have a support package. (However, this should be quite rare.)
Note that this GFE metric doesn't include latency for TCP/SSL handshake. If you have no idea about the latency cause based on client, GFE, and Cloud Spanner metrics, you may need to get a packet capture and check if there is high latency in TCP/SSL handshake. (However, this should also be quite rare.)
Investigate high latency in Cloud Spanner usage
If you observe high latency in Cloud Spanner metrics, the most typical cause is the lack of Spanner nodes. Make sure that your CPU utilization is within the recommended value in Alerts for high CPU utilization. Note that low/middle priority tasks (such as generating statistics packages, compaction, schema changes) don't affect higher priority tasks when the CPU utilization is low, but low priority tasks can affect higher ones when the utilization gets close to 100%.
If your CPU utilization is high, you can narrow down affecting queries based on Investigating high CPU utilization.
If you observe high latency even though the overall CPU utilization is not high, the cause may be due to hot spots or lock wait.
For hot spots, you can check the frequently accessed keys by Key Visualizer. In some cases, hot spots may subside due to optimizations in Cloud Spanner. However, optimizations cannot address all the cases depending on the key design or traffic pattern. Schema design best practices will be useful in such cases.
To investigate lock wait times, you can refer to Lock statistics. Note that because detailed information will become unavailable as time passes (see Data retention), it's more effective to check SPANNER_SYS.LOCK_STATS_TOP_MINUTE or SPANNER_SYS.LOCK_STATS_TOP_10MINUTE as soon as the high latency issue happens.
Also you can associate tags with your queries, read requests, and transactions. You'd be able to identify the cause of high latency more effectively by using the tagging feature and statistics tables.
Tips to avoid high latency
In most cases, you'll find the cause and measures based on the aforementioned approaches. Let me introduce some tips to avoid high latency for the use cases where you have difficulty in finding the cause based on statistics tables and Key Visualizer.
Use stale reads
Cloud Spanner guarantees strong consistency against read operations by default. However, using stale read even with short staleness (e.g. 1 sec) may improve performance dramatically. This can be effective especially when you need to read rows which are also updated frequently and don't require strong consistency with the updates.
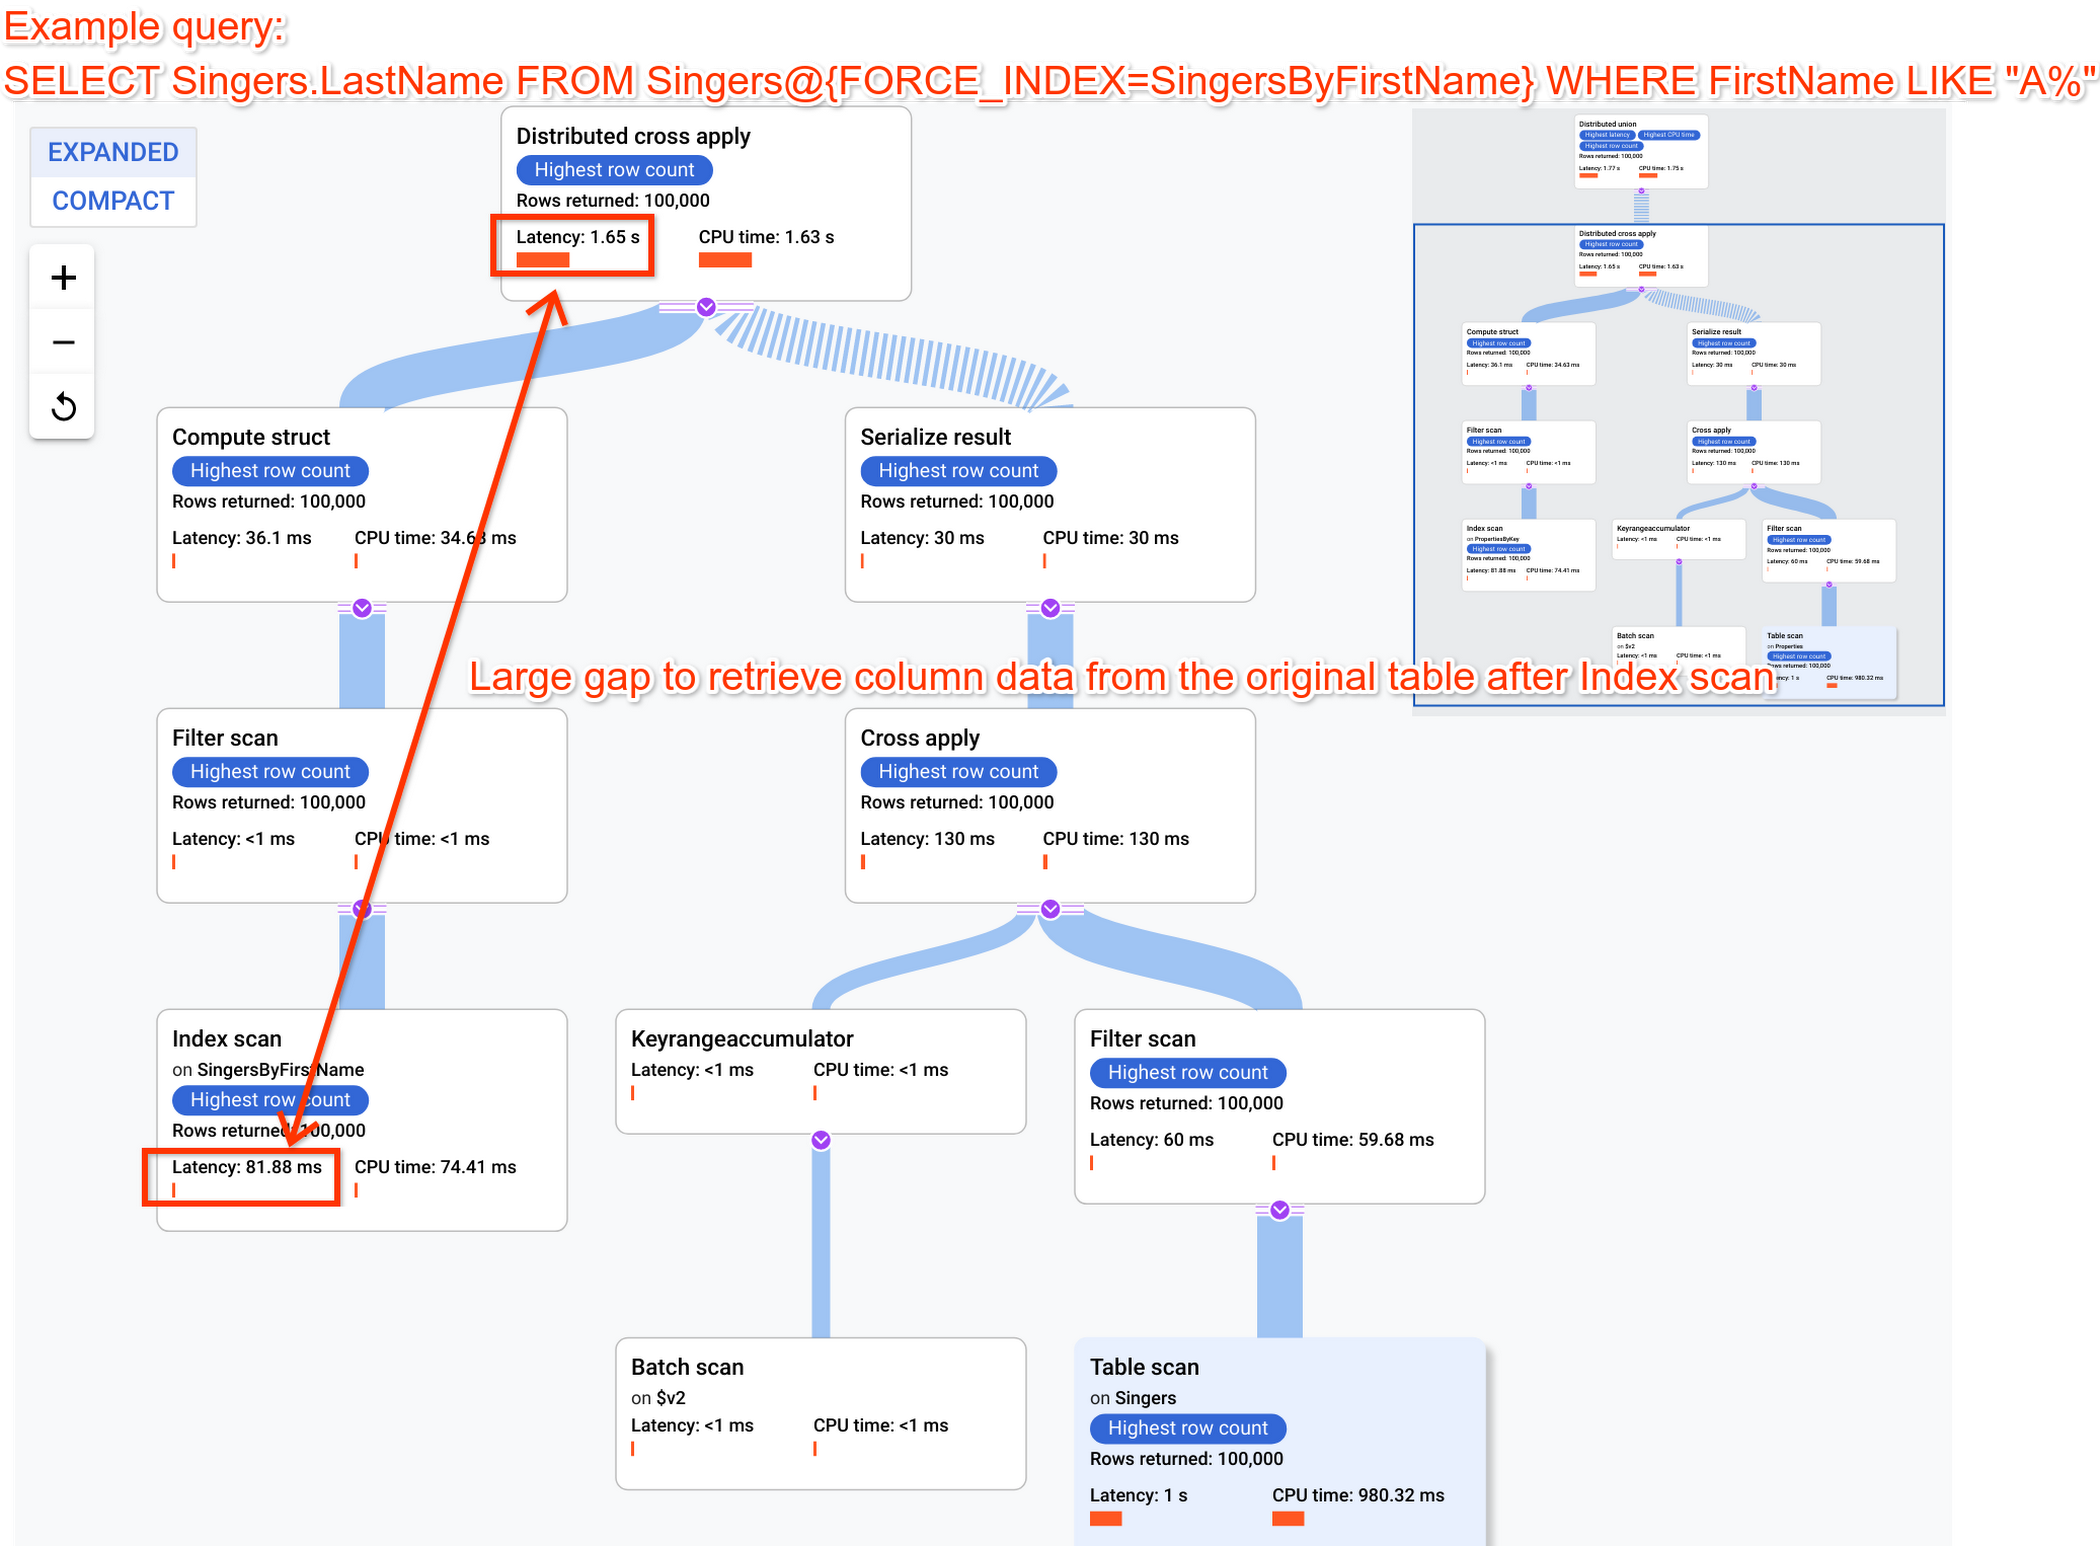
Incorporate column data into indexes by using STORING clause
When you use FORCE_INDEX in a SELECT query, you'll get results without scanning a base table from the index if the data in SELECT columns are stored in the index itself. You can achieve this by using the STORING clause.
If you see a large time gap between latency in Scan Index and latency in its upper Distributed Union/Distributed Cross Apply, using STORING clause would provide large performance gains.
Use Partitioned DML in deleting rows
In some use cases, you may want to delete some rows periodically. Creating a row deletion policy with TTL is the convenient approach, but if you want to do it on your own, you can minimize the scope of lock ranges by using Partitioned DML because it'll be executed in parallel, hence minimizing the effect to other requests. One caveat is that the operation must be idempotent. In other words, you can't use Partitioned DML if a difference between the result of performing the operation once and the result of performing it multiple times is not acceptable.
A few second latency at p99 can happen
There are some situations where you can't suppress such latency increases. The Spanner Frontend servers ([3. Cloud Spanner API Front End] in the latency guide) are occasionally restarted due to maintenance. If your request (session) happens to be on the server which is about to restart, it takes a few seconds in session takeover to another server. The maintenance is essential to ensure the service level and the tail latency due to this event is inevitable.
That's it. I hope this article will help you find the high latency cause and measure you haven't come up with.